Introduction: Why Forecast Accuracy Matters in Fashion
In the fast-paced fashion industry, demand forecast accuracy plays a critical role in determining profitability, sustainability, and customer satisfaction. When forecasts are inaccurate, the impact ripples across the entire supply chain—from raw material sourcing to finished product distribution. Brands that overproduce end up with excess inventory, heavy markdowns, and wasted resources, while underproduction results in lost sales, unsatisfied customers, and weakened brand trust.
Fashion is unpredictable. Demand patterns change constantly due to shifting trends, seasonal variations, social media influences, celebrity endorsements, and even unpredictable external factors like weather or economic shifts. Because of this, measuring forecast accuracy is not just a technical task—it’s a strategic advantage. Brands that consistently track and improve forecast accuracy gain the ability to react quickly to real-time market signals, reducing waste and maximizing sales opportunities.
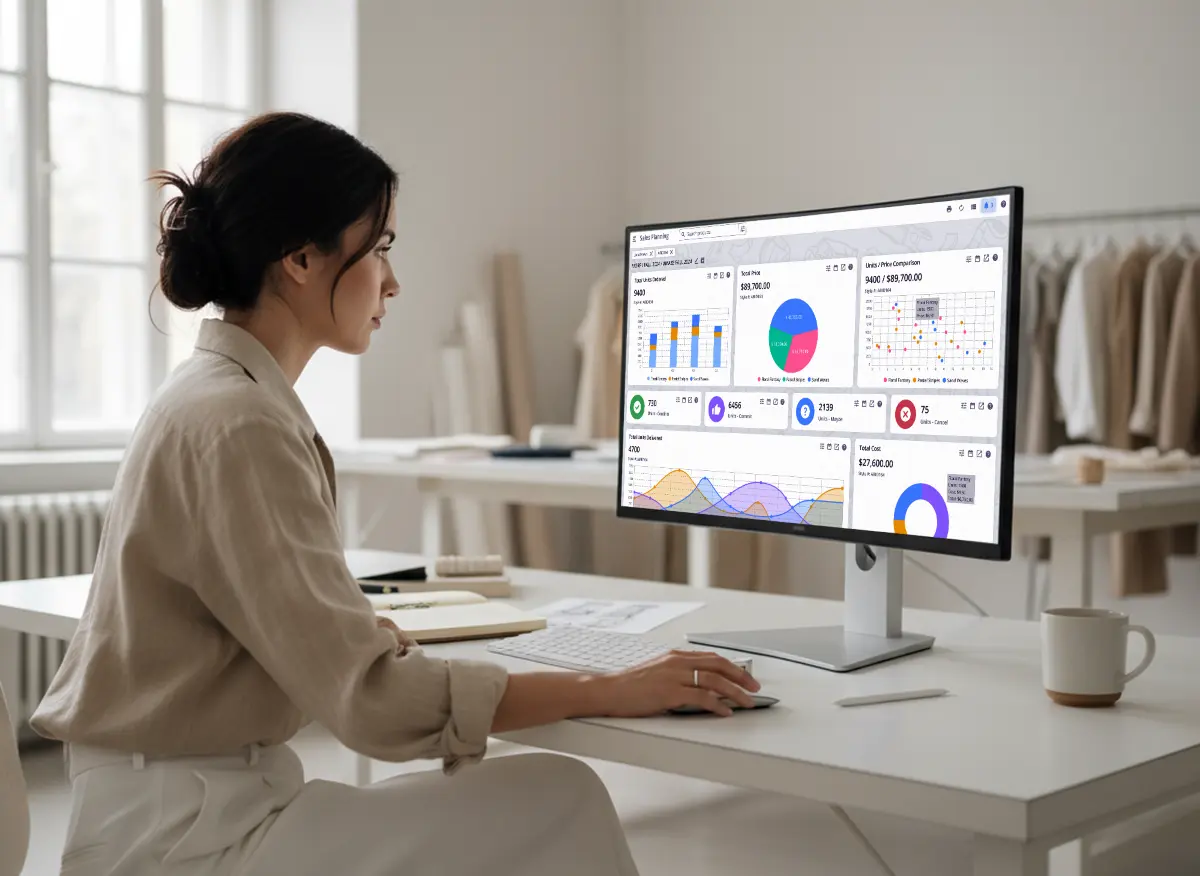
Modern Product Lifecycle Management (PLM) systems, such as Wave PLM, bring data, design, and operations together in one unified workspace. These platforms connect design teams, merchandisers, and supply chain planners, ensuring everyone works from the same real-time data. This connection makes demand forecasting more reliable, enabling planners to visualize forecast accuracy metrics directly on dashboards, compare performance across product lines, and refine future forecasts.
By using advanced analytics and AI-based forecasting models, brands can identify forecast errors, predict future demand more accurately, and continuously monitor performance. Every 1% improvement in forecast accuracy contributes directly to higher margins, improved sustainability, and smoother operations across the entire supply chain.
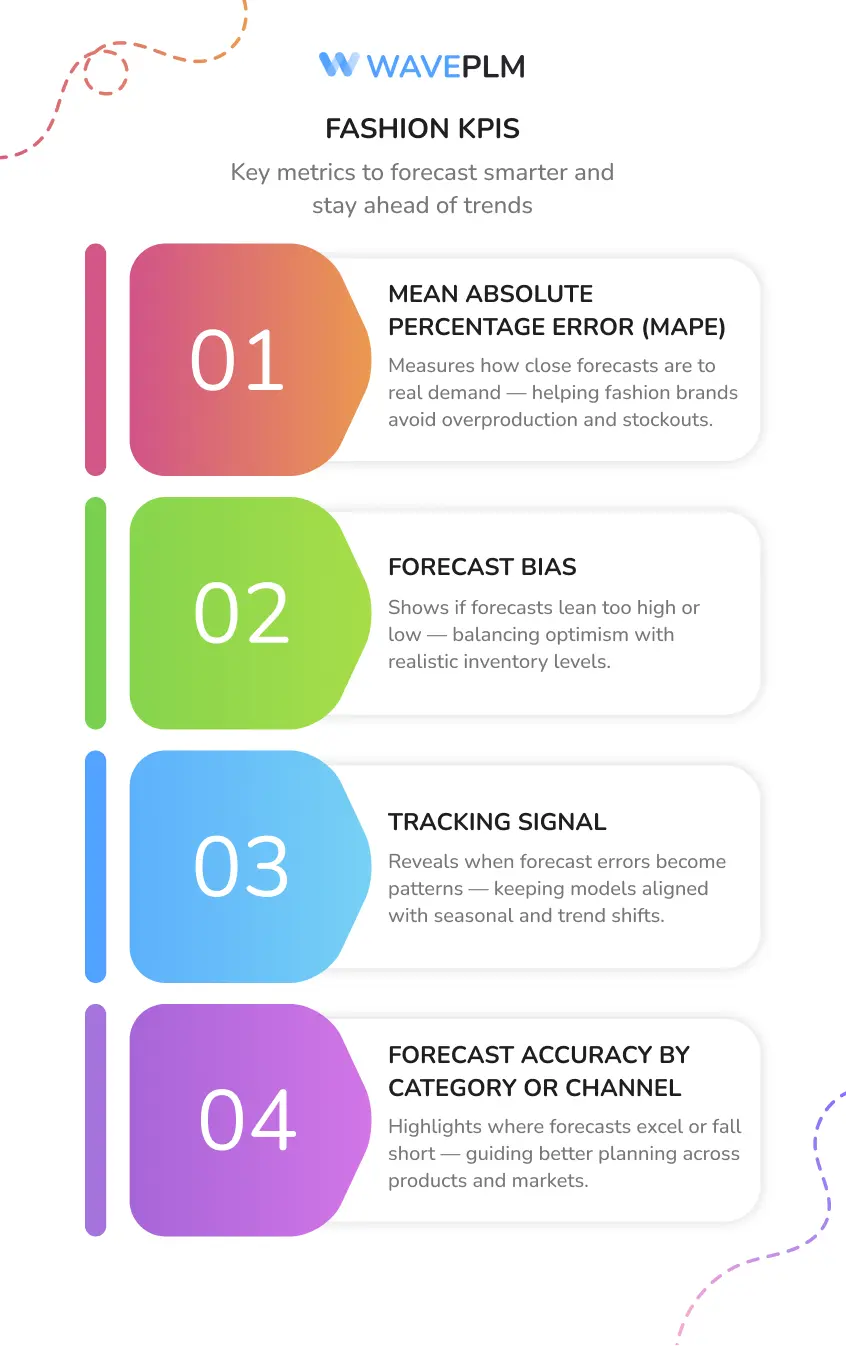
KPI #1: Mean Absolute Percentage Error (MAPE)
Definition: Mean Absolute Percentage Error (MAPE) is one of the most widely used forecast accuracy measures. It calculates the average difference between your forecasted and actual demand, expressed as a percentage of the actual value. It provides a clear, easy-to-understand indicator of how well your forecasts match reality.
Formula:
|
Metric |
Formula |
|---|---|
|
MAPE |
(Actual – Forecast / Actual) × 100 |
Example: If your MAPE equals 10%, your forecast error averages 10% from actual sales. This means your demand forecasts are fairly reliable, but there’s still room to improve.
Why It Matters: MAPE provides a universal way to measure forecast accuracy across categories and time periods. It helps teams pinpoint where forecasts deviate most from actual demand, allowing for faster correction. A lower MAPE means higher forecasting accuracy and more efficient production planning.
In Fashion: For apparel and footwear brands, MAPE helps track demand planning accuracy by style, SKU, or season. For example, a high MAPE for outerwear during winter may indicate unpredictable weather-driven demand, while accessories may show lower MAPE due to stable buying patterns. Wave PLM dashboards make it easy to monitor forecast accuracy by product or market region, helping demand planners improve forecast accuracy over time.
MAPE also promotes team alignment. Designers, buyers, and demand planners can all work from a single source of truth, comparing forecast accuracy results and improving cross-department collaboration.
KPI #2: Forecast Bias
Definition: Forecast Bias reveals whether your team consistently overestimates or underestimates actual demand. It identifies systematic tendencies within your forecasting process, helping you balance optimism with realism.
Formula:
|
Metric |
Formula |
|
Forecast Bias |
(Sum of Forecast Errors / Sum of Actuals) × 100 |
Example: A +7% bias means you’re consistently over-forecasting, leading to overproduction. A -5% bias means you’re under forecasting and missing potential sales.
Why It Matters: Forecast Bias affects more than inventory—it impacts production capacity, supplier commitments, and cash flow. Over forecasting ties up working capital in excess stock, while under forecasting leads to frequent stockouts. Tracking this KPI ensures your team sets achievable targets and maintains a realistic forecast horizon.
In Fashion: Forecast Bias is especially useful in fashion demand forecasting, where subjective judgment can heavily influence projections. For example, teams might over forecast due to excitement about a new collection or under forecast because of overly cautious planning. By continuously monitoring forecasting performance and reviewing forecast errors, fashion brands can achieve higher forecast accuracy and minimize financial risk.
Bias analysis also supports continuous improvement. Holding monthly review meetings to discuss forecast bias trends helps align merchandising and sourcing decisions, ensuring consistency between forecasted and actual values.
KPI #3: Tracking Signal
Definition: The Tracking Signal is a dynamic indicator used to detect whether forecasting errors are random or systematic. It measures how well your forecasting model stays aligned with actual outcomes.
Formula:
|
Metric |
Formula |
|
Tracking Signal |
Cumulative Forecast Error / Mean Absolute Deviation (MAD) |
Interpretation Tip: If your Tracking Signal moves outside -4 to +4, it’s time to recalibrate your forecasting method.
Why It Matters: The Tracking Signal helps maintain control over your forecast accuracy. It alerts planners when forecast errors accumulate in one direction, suggesting that the model or assumptions may need review. It’s a key part of monitoring forecast accuracy and keeping the forecasting process stable.
In Fashion: For instance, a Tracking Signal consistently above +4 for sneakers could mean over-forecasting, perhaps due to outdated trend assumptions. A signal below -4 might mean missed opportunities from under forecasting. By monitoring these indicators through PLM-integrated analytics, teams can respond quickly to forecast accuracy results and correct issues before they disrupt production or supply.
Tracking Signals complement other forecast accuracy metrics like MAPE and Bias, helping planners maintain balance between responsiveness and stability in the supply chain.
KPI #4: Demand Forecast Accuracy by Category or Channel
Definition: This KPI measures forecast accuracy across different segments—product categories, sales channels, or geographic regions. It helps businesses identify where forecasting accuracy is strongest and where improvements are needed.
Formula:
|
Metric |
Formula |
|
Forecast Accuracy (%) |
(1 – (Actual – Forecast/ Actual)) × 100 |
Example: If you forecasted 900 jackets and sold 1,000, your forecast accuracy is 90%. This gives a quick snapshot of how well you’re meeting customer demand.
Why It Matters: Each category behaves differently. Core basics might have steady demand patterns, while trend-driven collections vary significantly. Breaking down forecasting accuracy by category or channel makes it easier to localize improvements and reduce forecast errors.
In Fashion: Comparing online versus retail store accuracy helps highlight structural issues. ECommerce forecasts might be less accurate due to fast-changing promotions or influencer-driven spikes, while retail forecasts may align more closely with historical data. PLM and ERP integration makes it possible to track these forecast accuracy metrics at the SKU level, empowering demand planners to act on precise data insights.
Over time, evaluating forecast accuracy by channel supports smarter allocation, optimized safety stock, and leaner inventory management. This level of visibility improves supply chain planning and fosters continuous improvement in overall forecasting performance.
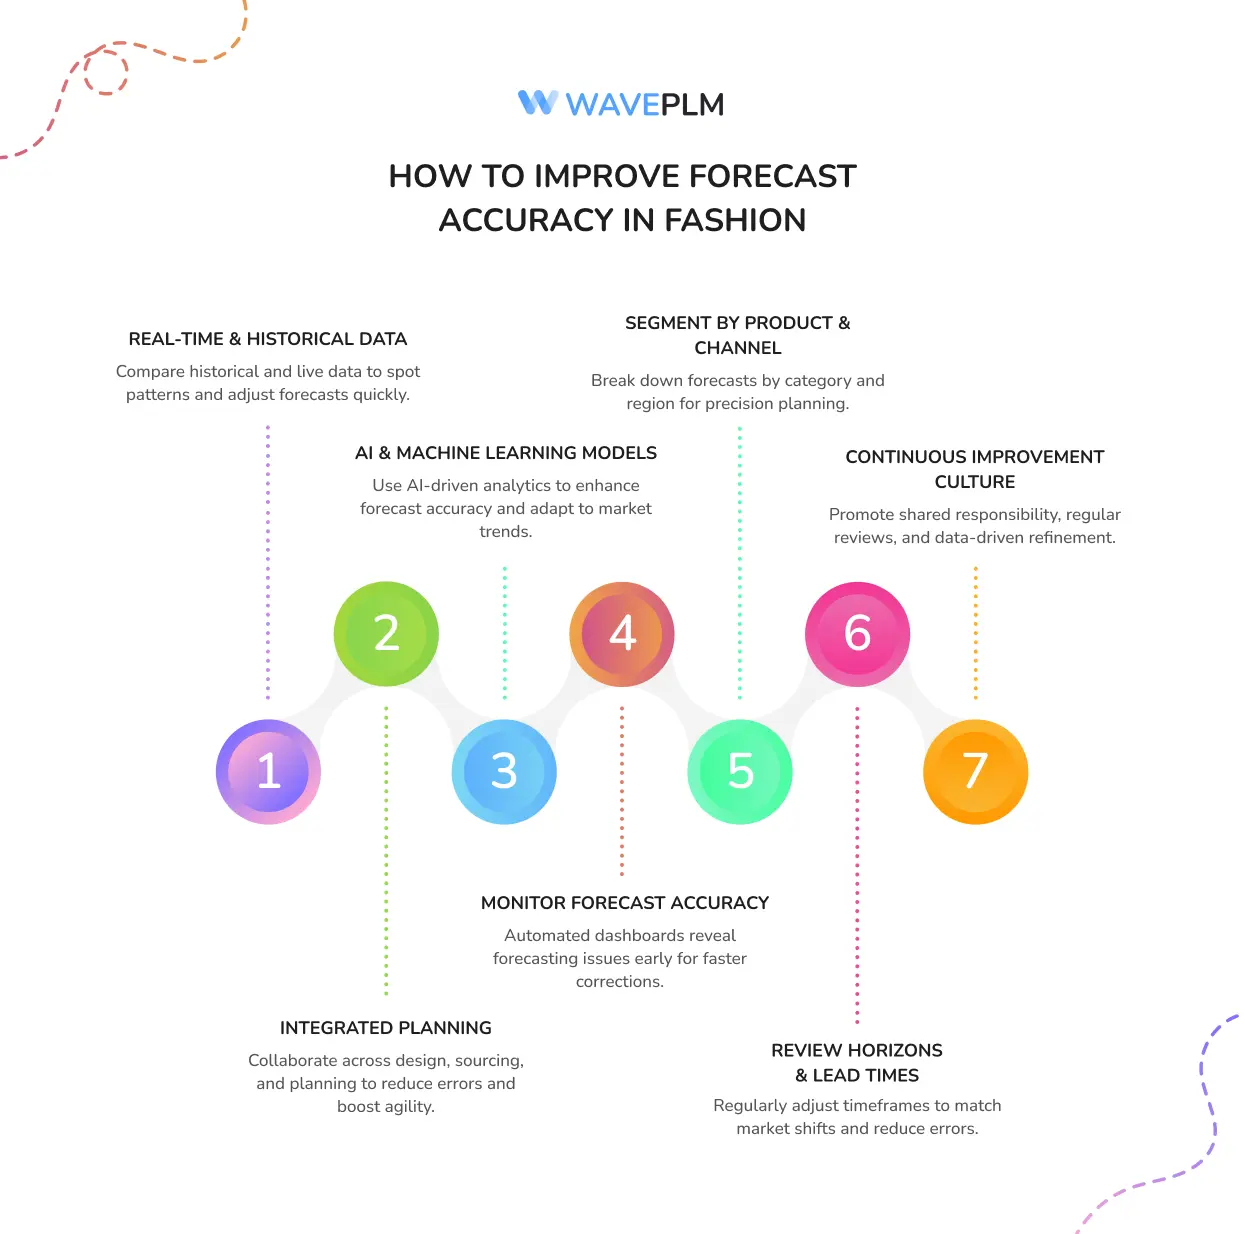
How to Improve Forecast Accuracy
Improving forecast accuracy is not a one-time effort; it’s an ongoing process that combines data, collaboration, and technology. Here’s how fashion brands can consistently improve:
1. Use Real-Time and Historical Data
Integrate live POS, eCommerce, and wholesale data into your PLM system. Comparing historical forecasts with actual values helps identify patterns and forecasting errors. Real-time feedback loops enable agile adjustments to future forecasts.
2. Through Integrated Planning
Wave PLM allows seamless collaboration between design, sourcing, merchandising, and planning teams. Shared visibility into forecast accuracy results ensures everyone operates with consistent information, reducing forecast errors and improving supply chain agility.
3. Apply AI and Machine Learning Models
AI-based forecasting models analyze past data, market trends, and external factors like weather or social sentiment. Machine learning continuously enhances prediction models, creating more accurate forecasts that adapt to evolving demand dynamics.
4. Regularly Monitor Forecast Accuracy
Establish automated dashboards that display KPIs such as MAPE, Bias, and Tracking Signal in real time. Consistent monitoring helps demand planners identify areas of concern early and make timely improvements.
5. Segment Forecasts by Product and Channel
Breaking forecasts down by product type, channel, and region allows for more granular decision-making. This segmentation improves forecast accuracy metrics and enhances supply chain planning.
6. Review Forecast Horizons and Lead Times
Regularly evaluate the forecast horizon to ensure it reflects market volatility and production lead times. Adjusting forecasting windows improves responsiveness and reduces forecasting errors.
7. Foster a Culture of Continuous Improvement
Encourage teams to view forecast accuracy as a shared responsibility. Regular training sessions, post-season reviews, and data-driven discussions strengthen collective forecasting capabilities and create a cycle of continuous improvement.
Expanded Quick Reference Table: Forecast Accuracy KPIs
|
KPI |
Purpose |
Formula |
Ideal Range |
Additional Insights |
|
MAPE |
Measures average absolute percentage error to evaluate deviation from actual demand |
(Actual – Forecast / Actual) × 100 |
Lower = better |
Excellent for comparing performance across SKUs, styles, and regions |
|
Forecast Bias |
Identifies systematic over or under forecasting tendencies |
(Sum of Forecast Errors / Sum of Actuals) × 100 |
Close to 0 |
Prevents recurring forecast errors and helps balance optimism with data accuracy |
|
Tracking Signal |
Detects random vs systematic forecasting errors |
Cumulative Forecast Error / MAD |
Between -4 and +4 |
Acts as a control mechanism to monitor forecasting performance |
|
Forecast Accuracy by Channel |
Evaluates forecast accuracy by product or channel |
(1 – (Actual – Forecast/ Actual)) × 100 |
85%+ ideal |
Useful for spotting underperforming segments or demand patterns |
Demand Forecast Accuracy Template for Teams
|
Product/Style |
Channel |
Forecast (Units) |
Actual (Units) |
MAPE |
Bias |
Tracking Signal |
Notes |
|
Denim Jacket |
Online |
1,200 |
1,000 |
16.7% |
+20% |
+5 |
Over forecasting due to influencer-driven spike |
|
Summer Dress |
Retail |
800 |
820 |
2.4% |
-2% |
-1 |
Accurate forecast with minimal deviation |
|
Winter Coat |
Retail |
1,500 |
1,350 |
10% |
+11% |
+3 |
Strong seasonal demand, slightly overestimated |
|
Sneakers |
eCommerce |
2,000 |
2,200 |
9.1% |
-9% |
-2 |
Surge in online demand from new collection launch |
|
Handbags |
Retail |
900 |
940 |
4.3% |
-4% |
+1 |
Stable performance, near-perfect forecast |
This expanded table enables teams to track forecasting accuracy systematically, detect recurring forecast errors, and maintain accountability across departments. Using it monthly builds a habit of proactive decision-making and enhances forecasting performance across the business.
Conclusion: Data-Driven Fashion Starts with Accurate Forecasts
In the world of fashion, precision planning beats intuition. Brands that master demand forecast accuracy gain full control of their supply chain, reduce waste, and build stronger relationships with customers. Reliable forecast accuracy metrics empower teams to move from reactive to predictive operations.
The journey to improve forecast accuracy is continuous. It requires commitment, technology, and collaboration. By integrating tools like Wave PLM, fashion companies can bridge design creativity with data intelligence, leading to more efficient, sustainable, and profitable operations.
Ready to elevate your demand forecasting process? Discover how Wave PLM helps fashion brands measure forecast accuracy, enhance collaboration, and create smarter, more sustainable forecasts that keep you ahead of the curve.


Leave a Reply