

Sell-through rate is the share of inventory you actually sold during a set period. For example, if you received 1,000 units of a jacket and sold 600 by the end of the season, your sell-through rate is 60%. Most fashion brands aim for 60–80% over a season. Below 50%, a style usually needs action.
However, the headline number hides a lot. A style can hit 90% and still lose money if half of it sold on markdown. Similarly, a healthy style total can mask a size run where XL never moved. This guide covers the formula, a realistic weekly curve, and what to do when the numbers fall behind. It also explains why most sell-through problems start in product development, long before a garment reaches the rail.
What Is Sell-Through Rate?
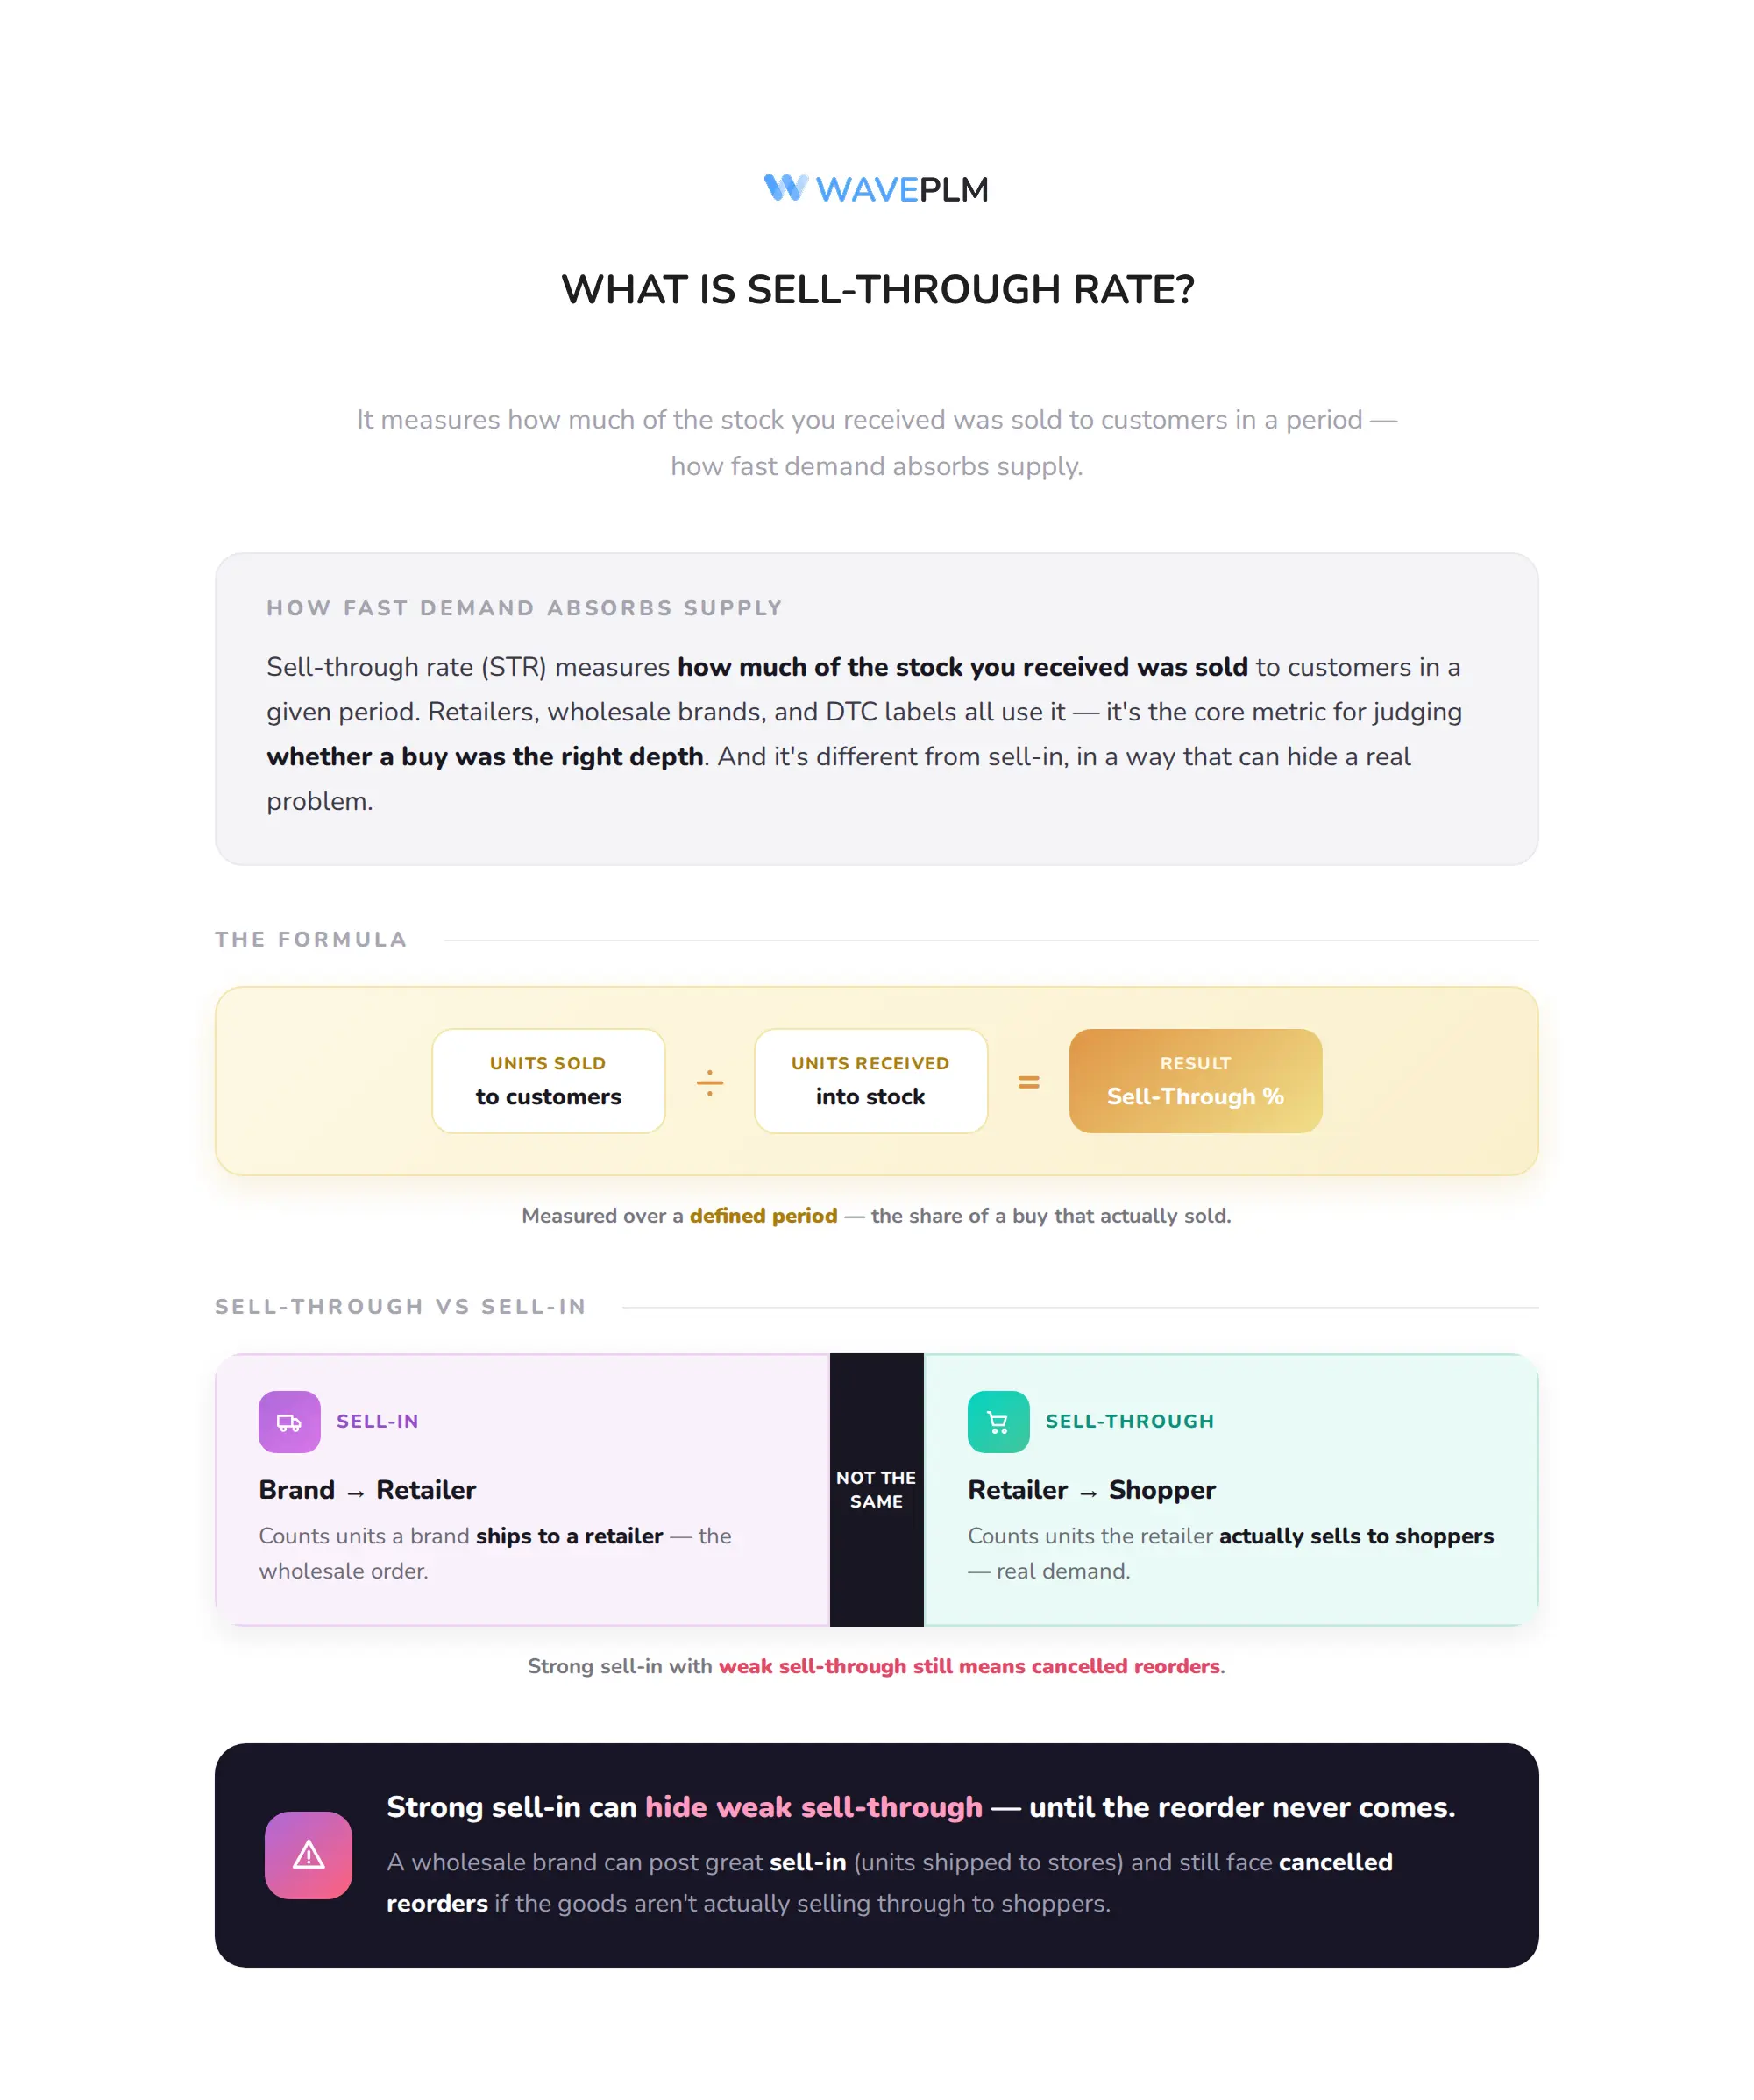
Sell-through rate (STR) measures how much of the stock you received was sold to customers in a given period. In other words, it tells you how fast demand absorbs supply. Retailers, wholesale brands, and DTC labels all use it. Specifically, it is the core metric for judging whether a buy was the right depth.
Notably, sell-through is different from sell-in. Sell-in counts units a brand ships to a retailer. Sell-through counts units that retailer sells to shoppers. A wholesale brand can post strong sell-in and still face cancelled reorders if the sell-through rate at the store is weak.
How Do You Calculate Sell-Through Rate?
The standard formula is simple:
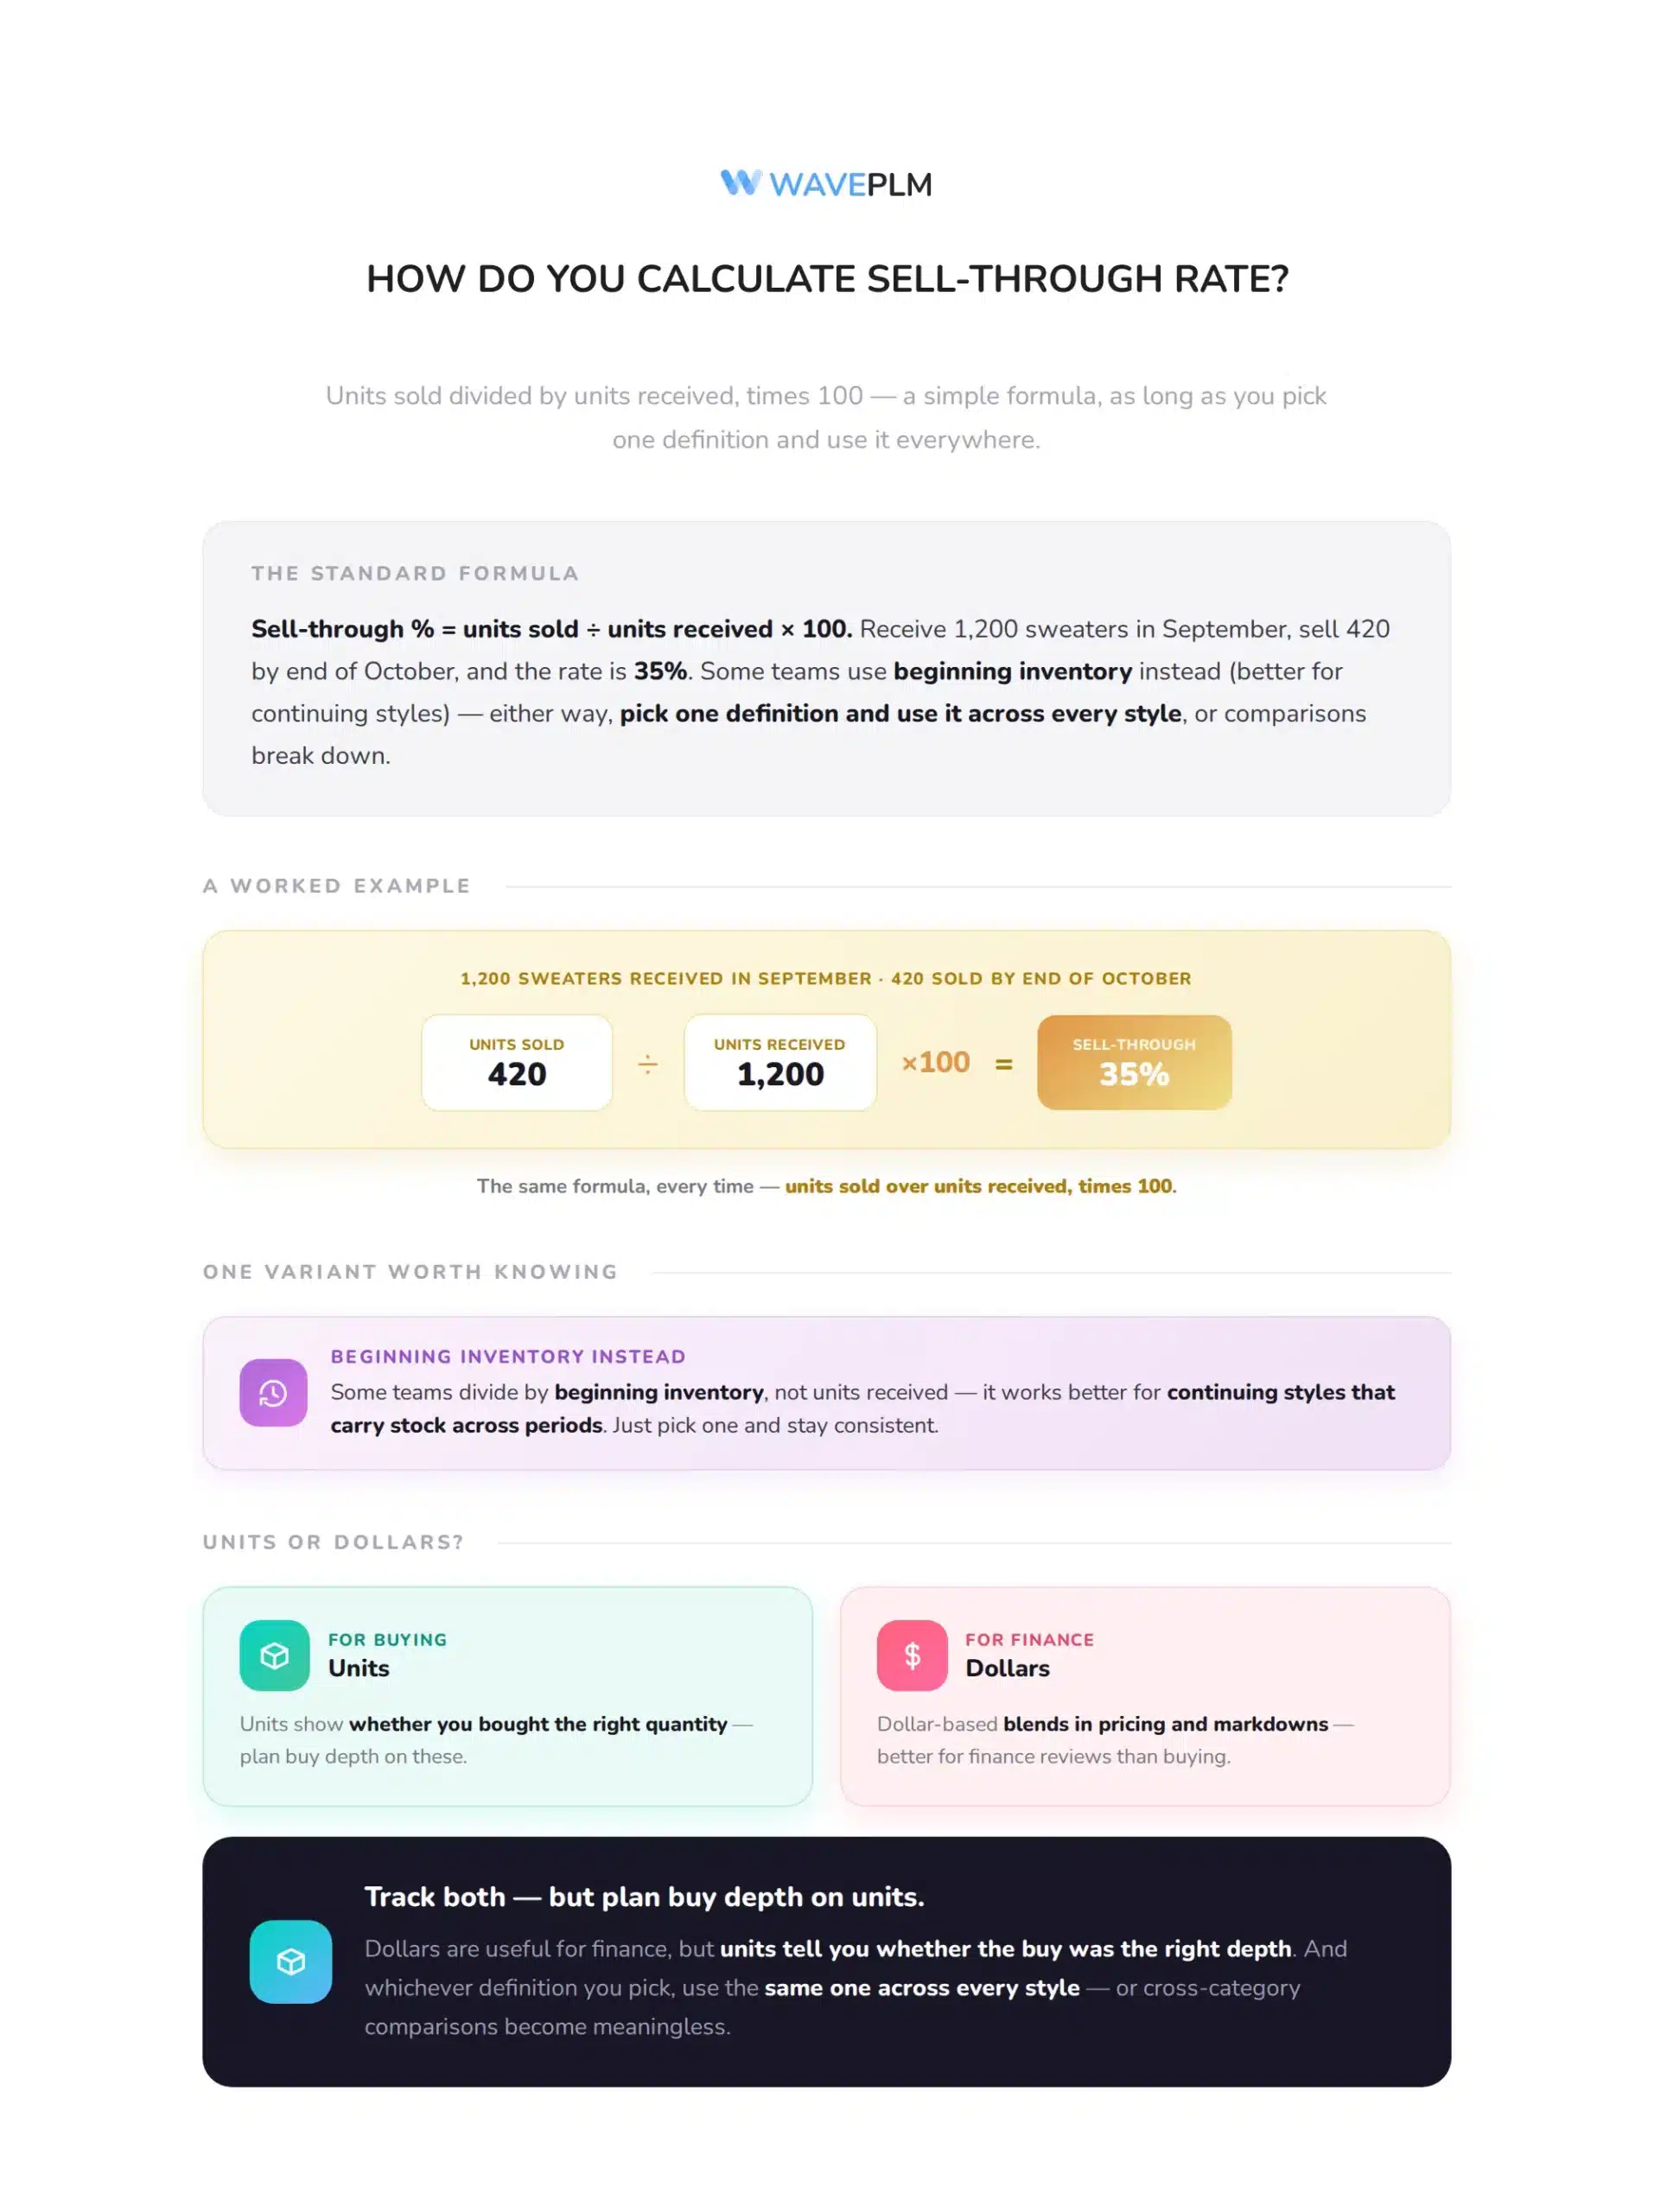
Sell-through rate (%) = units sold ÷ units received × 100
For instance, a brand receives 1,200 units of a knit sweater in September. By the end of October, it has sold 420 units. Therefore, the sell-through rate for that period is 420 ÷ 1,200 × 100 = 35%.
Some teams use beginning inventory instead of units received. That version works better for continuing styles that carry stock across periods. Either way, pick one definition and use it across every style. Otherwise, comparisons between categories become meaningless.
Units or Dollars?
Most apparel teams calculate sell-through rate in units. Units show whether you bought the right quantity. Dollar-based sell-through, by contrast, blends in pricing and markdowns. As a result, it is better for finance reviews than for buying decisions. Ideally, track both, but plan depth on units.
What Is a Good Sell-Through Rate for Apparel?
There is no single target, because category and business model change the answer. That said, published fashion benchmarks cluster in a clear range.
Industry data: The benchmark sell-through rate in fashion “typically hovers around 60–80%.” Fast-fashion brands target 80% or higher, luxury brands often aim lower at around 50%, and an STR below 50% “signals the need for intervention” (Heuritech, 2025).
Timing matters just as much as the final number. A 30% sell-through rate is excellent after two weeks and alarming after ten. For that reason, plan a curve, not a single end-of-season target. The table below shows an illustrative full-price curve for a 12-week seasonal style.
| Week of season | Cumulative full-price sell-through (plan) | What it usually signals |
|---|---|---|
| Week 2 | 10–15% | Early read on demand; too soon to mark down |
| Week 4 | 25–35% | First decision point for reorders or promotions |
| Week 8 | 50–60% | Style is on track for a full-price finish |
| Week 12 | 65–80% | Healthy close; remainder moves to markdown or off-price |
Meanwhile, continuing basics follow a different logic. A black crew-neck tee may sit at 20% per month forever and still be a great style, as long as it replenishes on time. So judge basics on weeks of supply and stockouts, not seasonal sell-through.
Why Does Full-Price Sell-Through Matter More Than Total?
Total sell-through counts every unit sold, at any price. Full-price sell-through counts only units sold before markdown. The gap between them is where margin disappears. Consider two styles with the same 1,000-unit buy, a $15 unit cost, and a $50 retail price.
| Metric | Style A | Style B |
|---|---|---|
| Units sold at full price ($50) | 650 | 450 |
| Units sold on markdown | 0 | 450 at 50% off ($25) |
| Total sell-through rate | 65% | 90% |
| Full-price sell-through rate | 65% | 45% |
| In-season revenue | $32,500 | $33,750 |
| Leftover units liquidated off-price at $15 | 350 → $5,250 | 100 → $1,500 |
| Total revenue | $37,750 | $35,250 |
Our finding: In this worked example, Style B reports a 90% sell-through rate against 65% for Style A. Even so, Style A earns $2,500 more because every unit it sold went at full price. Consequently, a dashboard that shows only total sell-through would reward the weaker style.
Additionally, markdown depth compounds over a whole line. According to McKinsey, markdown optimization alone can improve margin rates by 400 to 800 basis points. For that reason, report full-price sell-through as its own column. Our guide to keystone pricing for apparel brands shows how the starting markup sets how much markdown room you really have.
Why Should You Track Sell-Through by Size and Color?
A style-level number averages away the most useful signal. For example, a dress can post 62% overall while medium sells out in week five and XL barely moves. In that case, the problem is not demand. Instead, it is the size curve you bought.
| Size | Units received | Units sold (week 8) | Sell-through rate |
|---|---|---|---|
| XS | 100 | 55 | 55% |
| S | 250 | 190 | 76% |
| M | 300 | 285 | 95% (stockout risk) |
| L | 250 | 140 | 56% |
| XL | 100 | 30 | 30% |
| Style total | 1,000 | 700 | 70% |
Here, the style looks healthy at 70%. Still, medium is nearly gone and XL is stuck at 30%. The next buy should shift units from XL to M, not simply repeat the same curve. Likewise, colorways need the same split: one weak color often drags down an otherwise strong style. If you sell an extended range, our article on extended size grading and size-curve shifts covers how to rebuild curves from real sales.
What Should You Do When Sell-Through Rate Is Low?
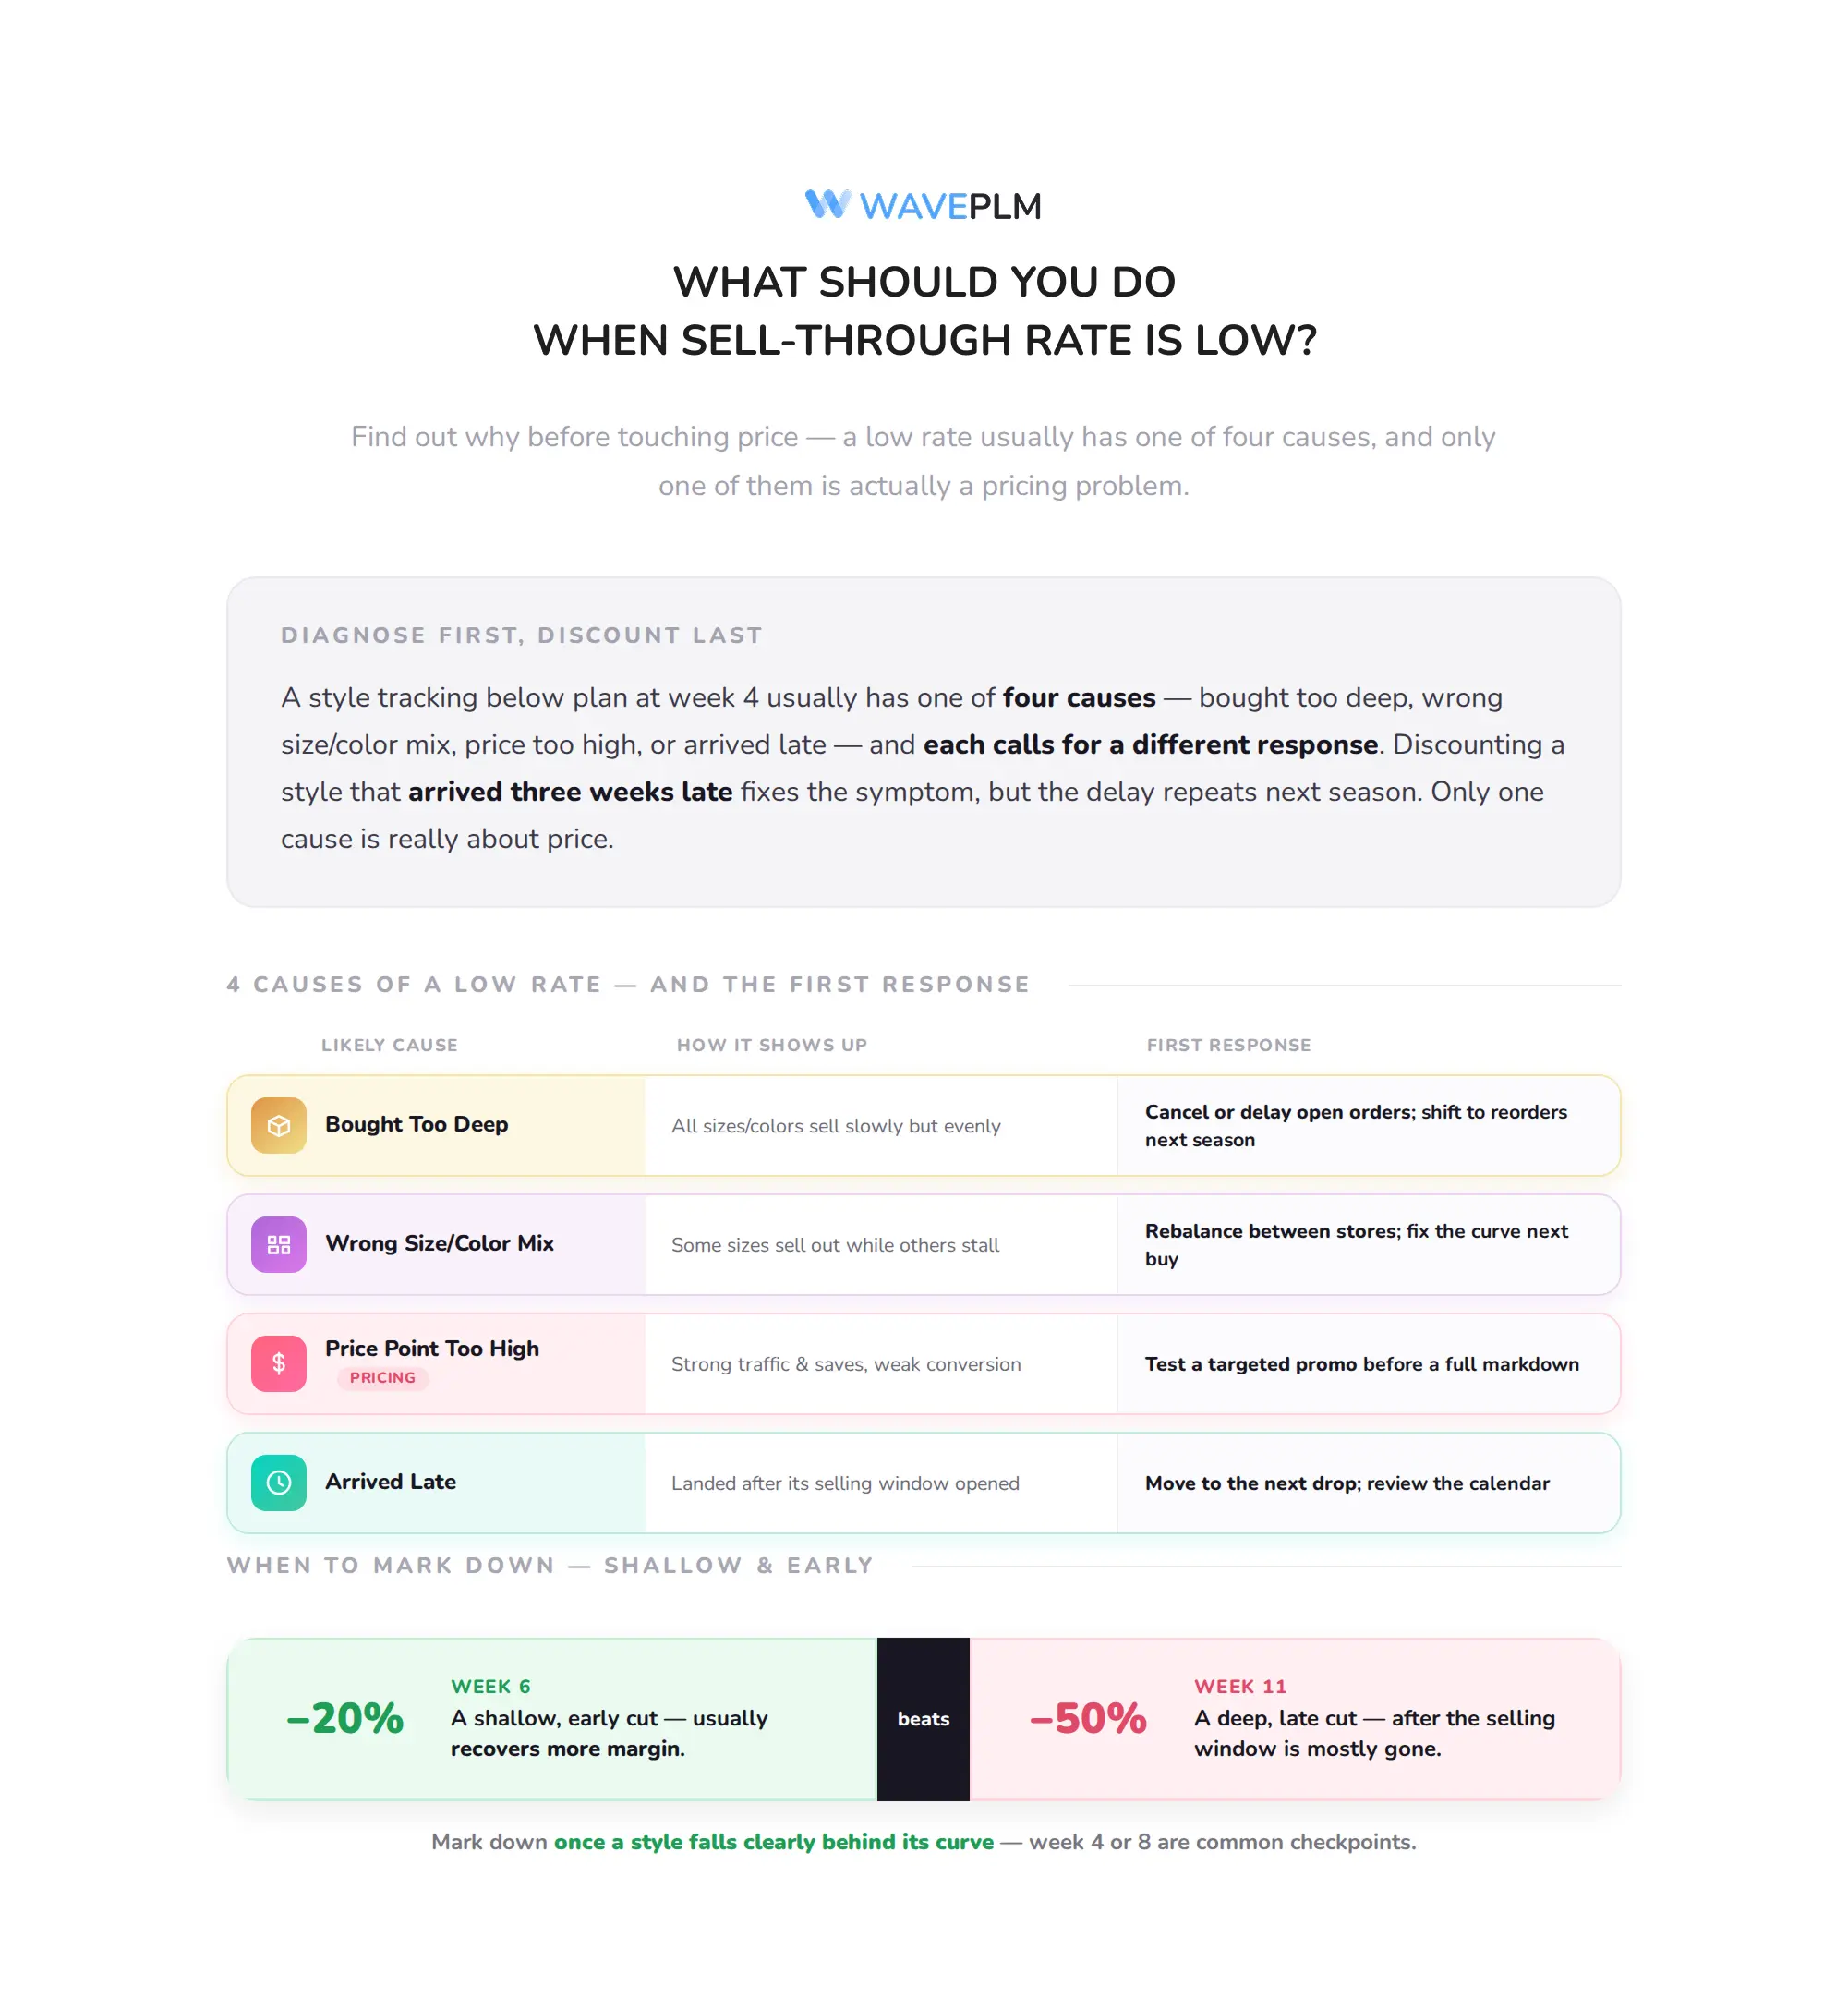
First, find out why it is low before touching price. A low sell-through rate usually has one of four causes. Each one calls for a different response.
| Likely cause | How it shows up | First response |
|---|---|---|
| Bought too deep | All sizes and colors sell slowly but evenly | Cancel or delay open orders; shift to reorders next season |
| Wrong size or color mix | Some sizes sell out while others stall | Rebalance between stores or channels; fix the curve on the next buy |
| Price point too high | Strong traffic and saves, weak conversion | Test a targeted promotion before a full markdown |
| Arrived late | Style landed after its selling window opened | Move to the next relevant drop; review the calendar |
Notably, only one of those four causes is really a pricing problem. Discounting a style that arrived three weeks late fixes the symptom, but the same delay will repeat next season. Our fashion seasonal planning calendar guide covers how to keep delivery dates tied to the selling window.
When Should You Mark Down?
Generally, a first markdown makes sense once a style falls clearly behind its curve at a fixed checkpoint. Week four and week eight are common. Beyond that, keep markdowns shallow and early rather than deep and late. A 20% cut in week six usually recovers more margin than a 50% cut in week eleven.
How Do Development Decisions Set Your Sell-Through Rate?
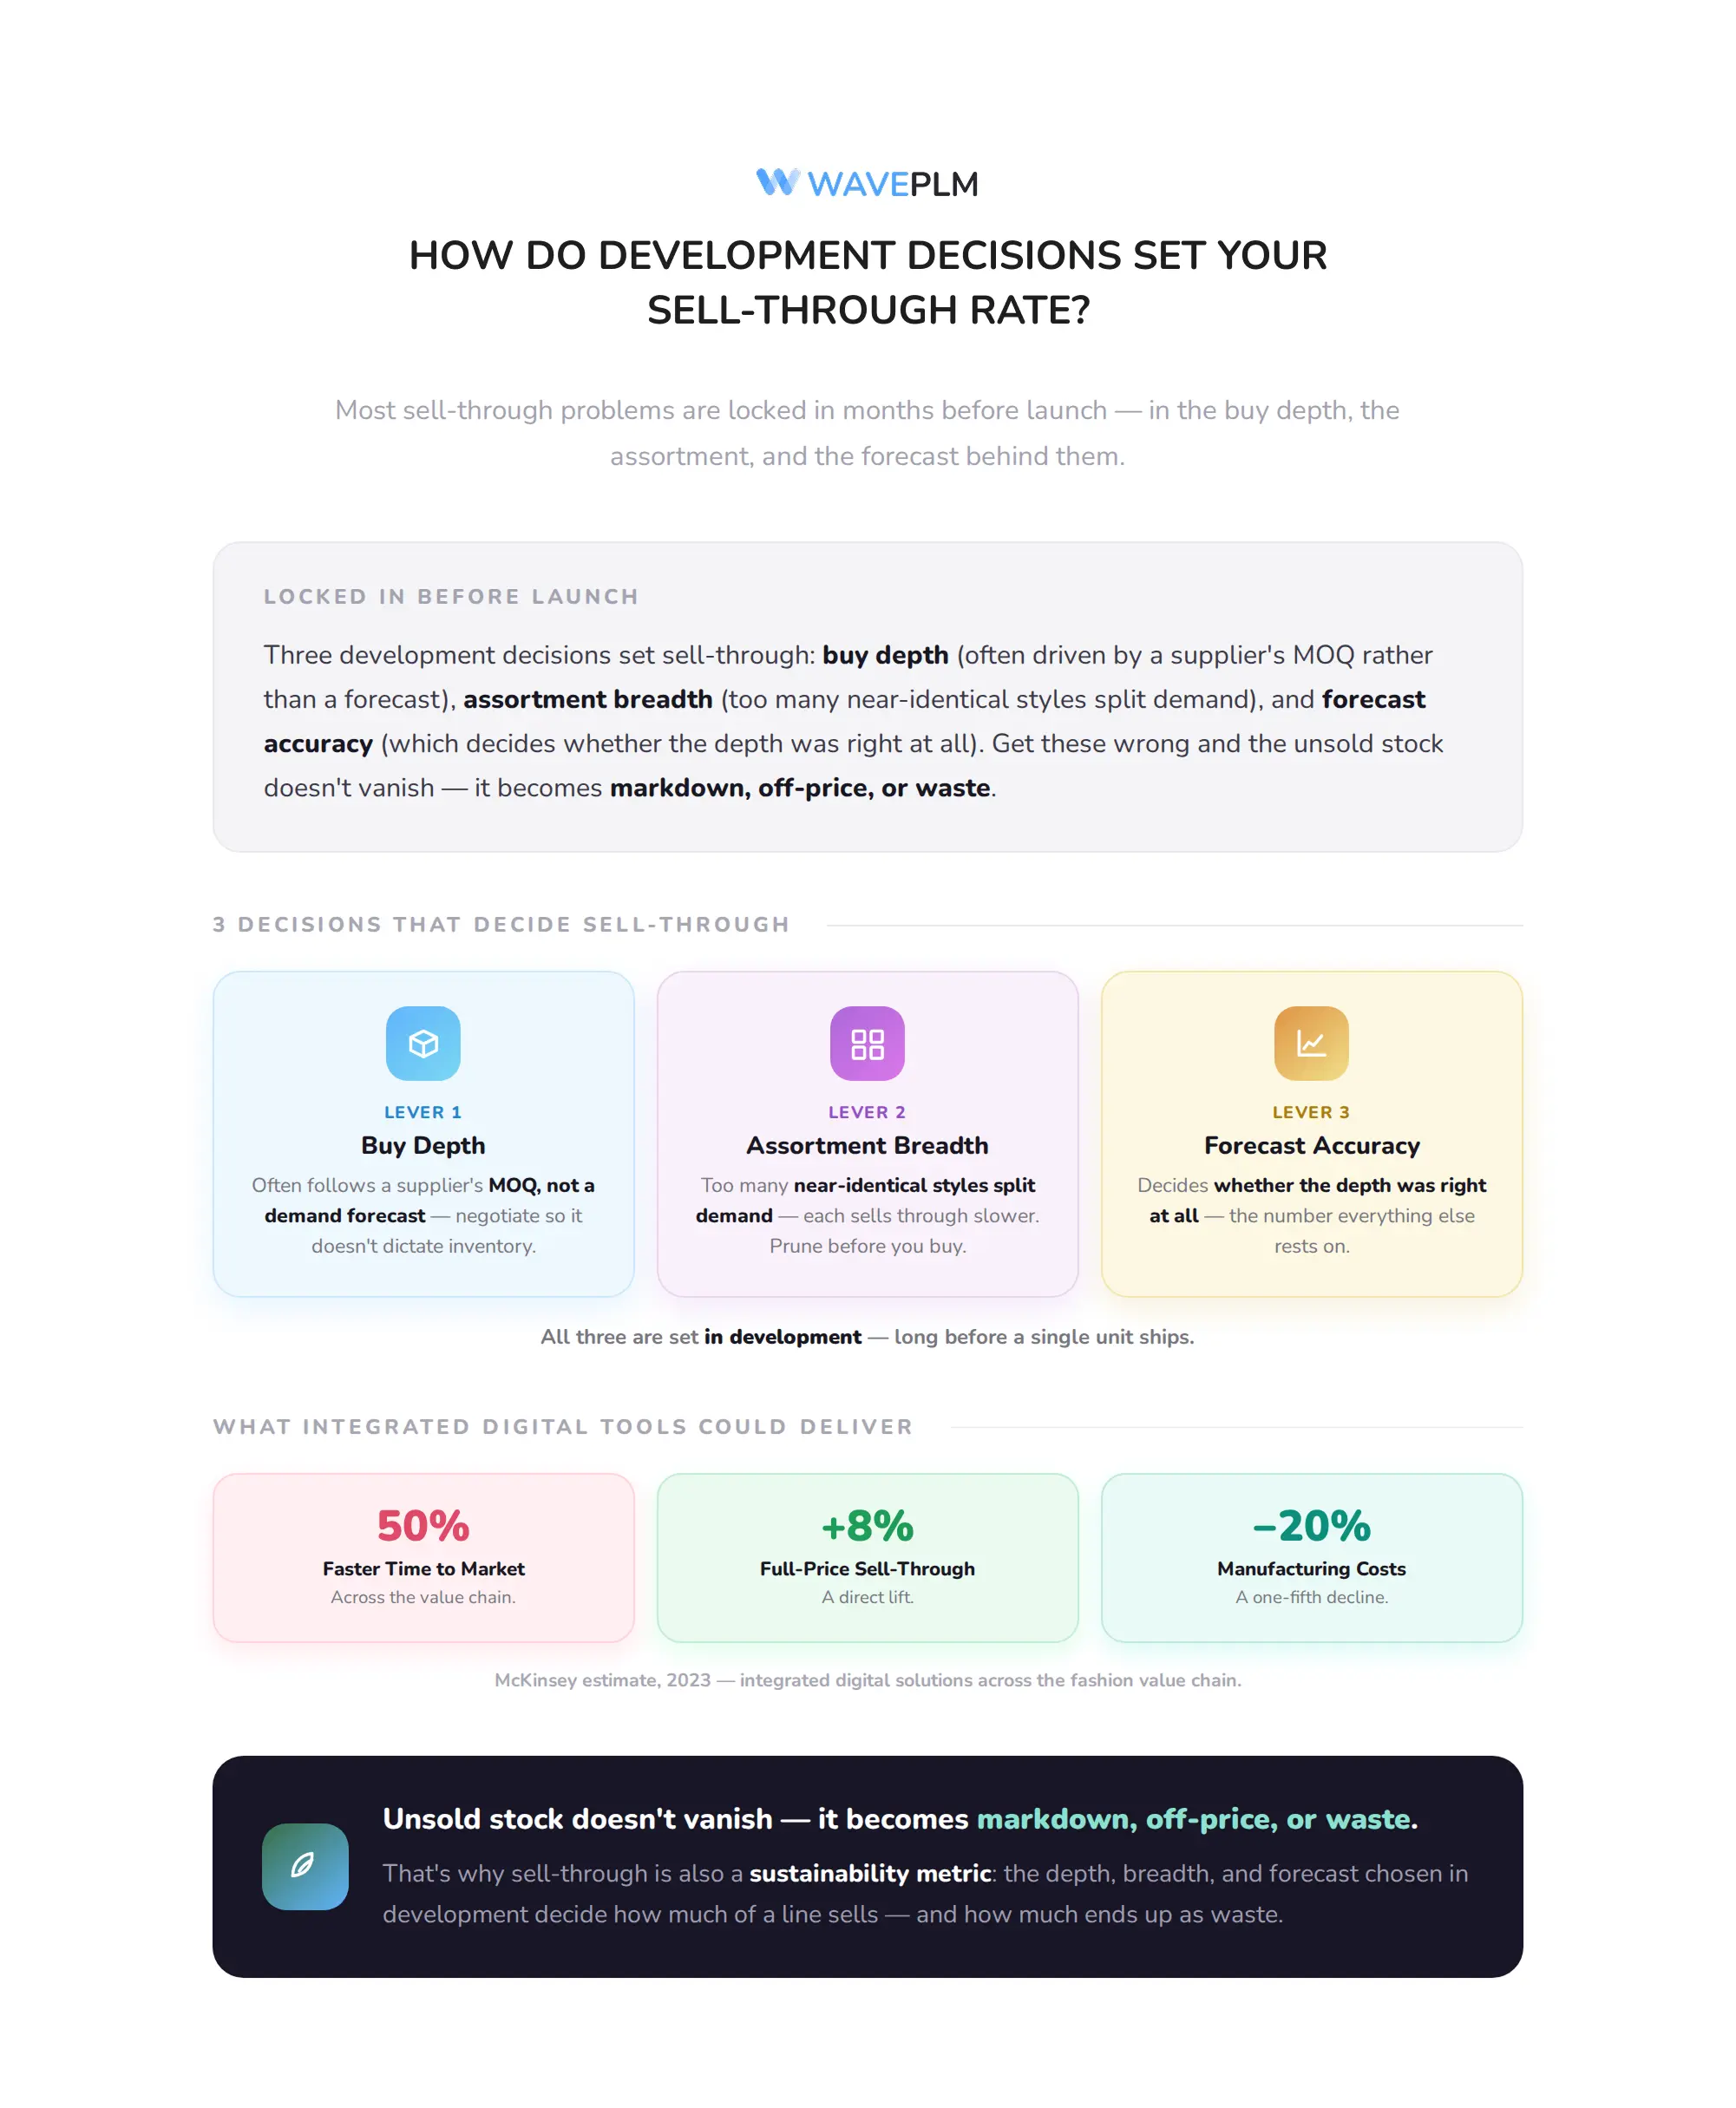
Most sell-through problems are locked in months before launch. For instance, the buy depth often follows a supplier’s minimum order quantity rather than a demand forecast. Our guide to minimum order quantity in apparel manufacturing explains how to negotiate MOQs so they do not dictate your inventory.
Similarly, assortment breadth matters. Too many near-identical styles split demand, so each one sells through slower. Our article on assortment optimization covers how to prune a line before it is bought. In addition, forecast accuracy decides whether the depth was right at all. We cover that in four demand forecast accuracy KPIs.
Industry data: McKinsey estimates that integrated digital solutions across the fashion value chain could deliver “50 percent faster time to market, an 8 percent rise in full-price sell through, and a 20 percent decline in manufacturing costs” (McKinsey, 2023).
Finally, unsold stock does not simply vanish. It becomes markdown, off-price inventory, or waste. That is why sell-through is also a sustainability metric, as our article on textile waste that fashion brands control explains.
How Does PLM Software Help Improve Sell-Through?
A PLM system does not sell garments. However, it holds the decisions that drive sell-through: the line plan, buy quantities, size curves, colorways, costs, and delivery dates. When those live in one style record, the team can compare what it planned with what sold. As a result, next season’s buy starts from real sell-through data instead of last year’s spreadsheet.
In practice, that means linking each style’s size curve and buy quantity to its sales results. It also means flagging late deliveries against the seasonal calendar before they become markdowns. For the wider picture, see our fashion PLM software guide.

Frequently Asked Questions
What is a good sell-through rate for clothing?
For seasonal apparel, a good sell-through rate is usually 60–80% by the end of the season. Fast-fashion brands often target 80% or more, while luxury brands may accept around 50%. A rate below 50% generally means the style needs intervention.
What is the sell-through rate formula?
Sell-through rate equals units sold divided by units received, multiplied by 100. For example, selling 420 units out of 1,200 received gives a 35% sell-through rate. Some teams use beginning inventory instead of units received for continuing styles.
What is the difference between sell-through and sell-in?
Sell-in is the number of units a brand ships to a retailer. Sell-through is the share of those units the retailer sells to consumers. Strong sell-in with weak sell-through usually leads to cancelled reorders and markdown requests.
How often should apparel brands check sell-through rate?
Weekly for seasonal styles, with formal decision points at around week four and week eight. Continuing basics can be reviewed monthly, alongside weeks of supply and stockout rates.
Is a 100% sell-through rate a good thing?
Not always. A 100% sell-through rate early in the season often means you bought too shallow and lost sales to stockouts. The goal is a high full-price sell-through rate near the end of the selling window, not an early sellout.
How can a brand improve its sell-through rate?
Start by finding the cause: buy depth, size or color mix, price point, or late delivery. Then fix it at the source, for example by adjusting size curves, negotiating smaller MOQs, pruning the assortment, or tightening the seasonal calendar.
Turning Sell-Through Into Better Buys
Sell-through rate is easy to calculate and easy to misread. Track it weekly, split it by size and color, and keep full-price sell-through in its own column. Above all, feed each season’s results back into the line plan, because that is where the next season’s sell-through is decided. To connect size curves, buy quantities, and delivery dates in one record, explore how Wave PLM links planning to product data.








Leave a Reply