
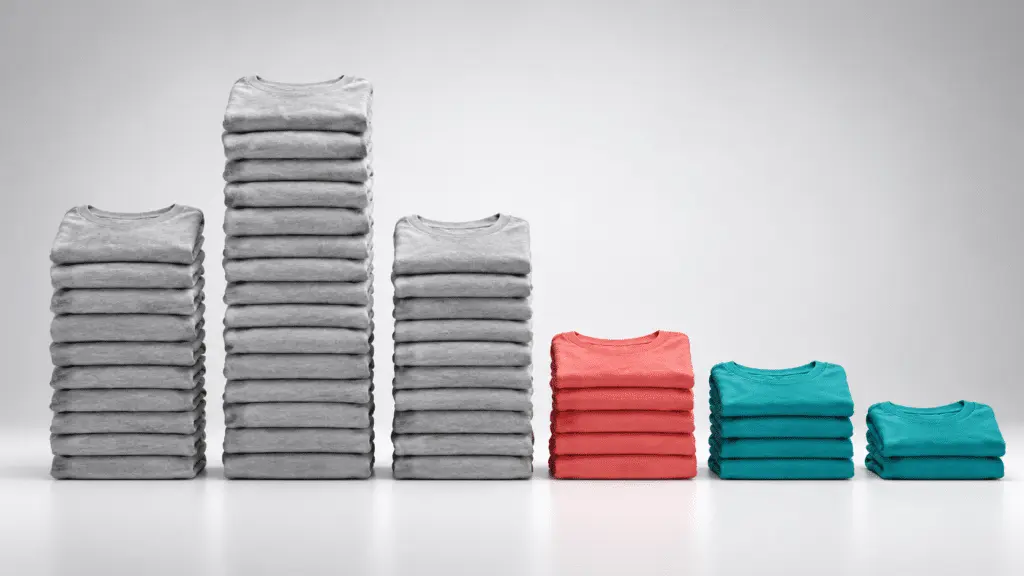
The inventory turnover ratio measures how many times a business sells and replaces its stock in a year. You calculate it by dividing cost of goods sold by average inventory at cost. For apparel, a higher inventory turnover ratio usually means fresher product, fewer markdowns, and less cash tied up in the warehouse.
However, most explanations stop at the formula. For a clothing brand, though, the more useful question is where low turns come from. Often, the answer sits upstream, in decisions made during product development: how many styles, how many colourways, and how much each factory insists you buy. Accordingly, this guide covers the formula, realistic benchmarks, GMROI, and those upstream levers.
What Is the Inventory Turnover Ratio?
In simple terms, the inventory turnover ratio tells you how fast inventory turns into sales. A ratio of 4 means the average unit sat in stock for about three months before it sold. By contrast, a ratio of 2 means about six months.
Definition: Inventory turnover ratio = cost of goods sold ÷ average inventory at cost. Average inventory is usually (opening inventory + closing inventory) ÷ 2 for the period, or the average of monthly balances for more accuracy.
Two companion numbers make the ratio easier to use. First, days inventory outstanding (DIO) converts turns into days: 365 ÷ inventory turnover. Second, weeks of supply looks forward instead of back: current inventory ÷ average weekly sales. In practice, planners use weeks of supply in season, while finance teams report turns at year end.
How Do You Calculate Inventory Turnover for an Apparel Brand?
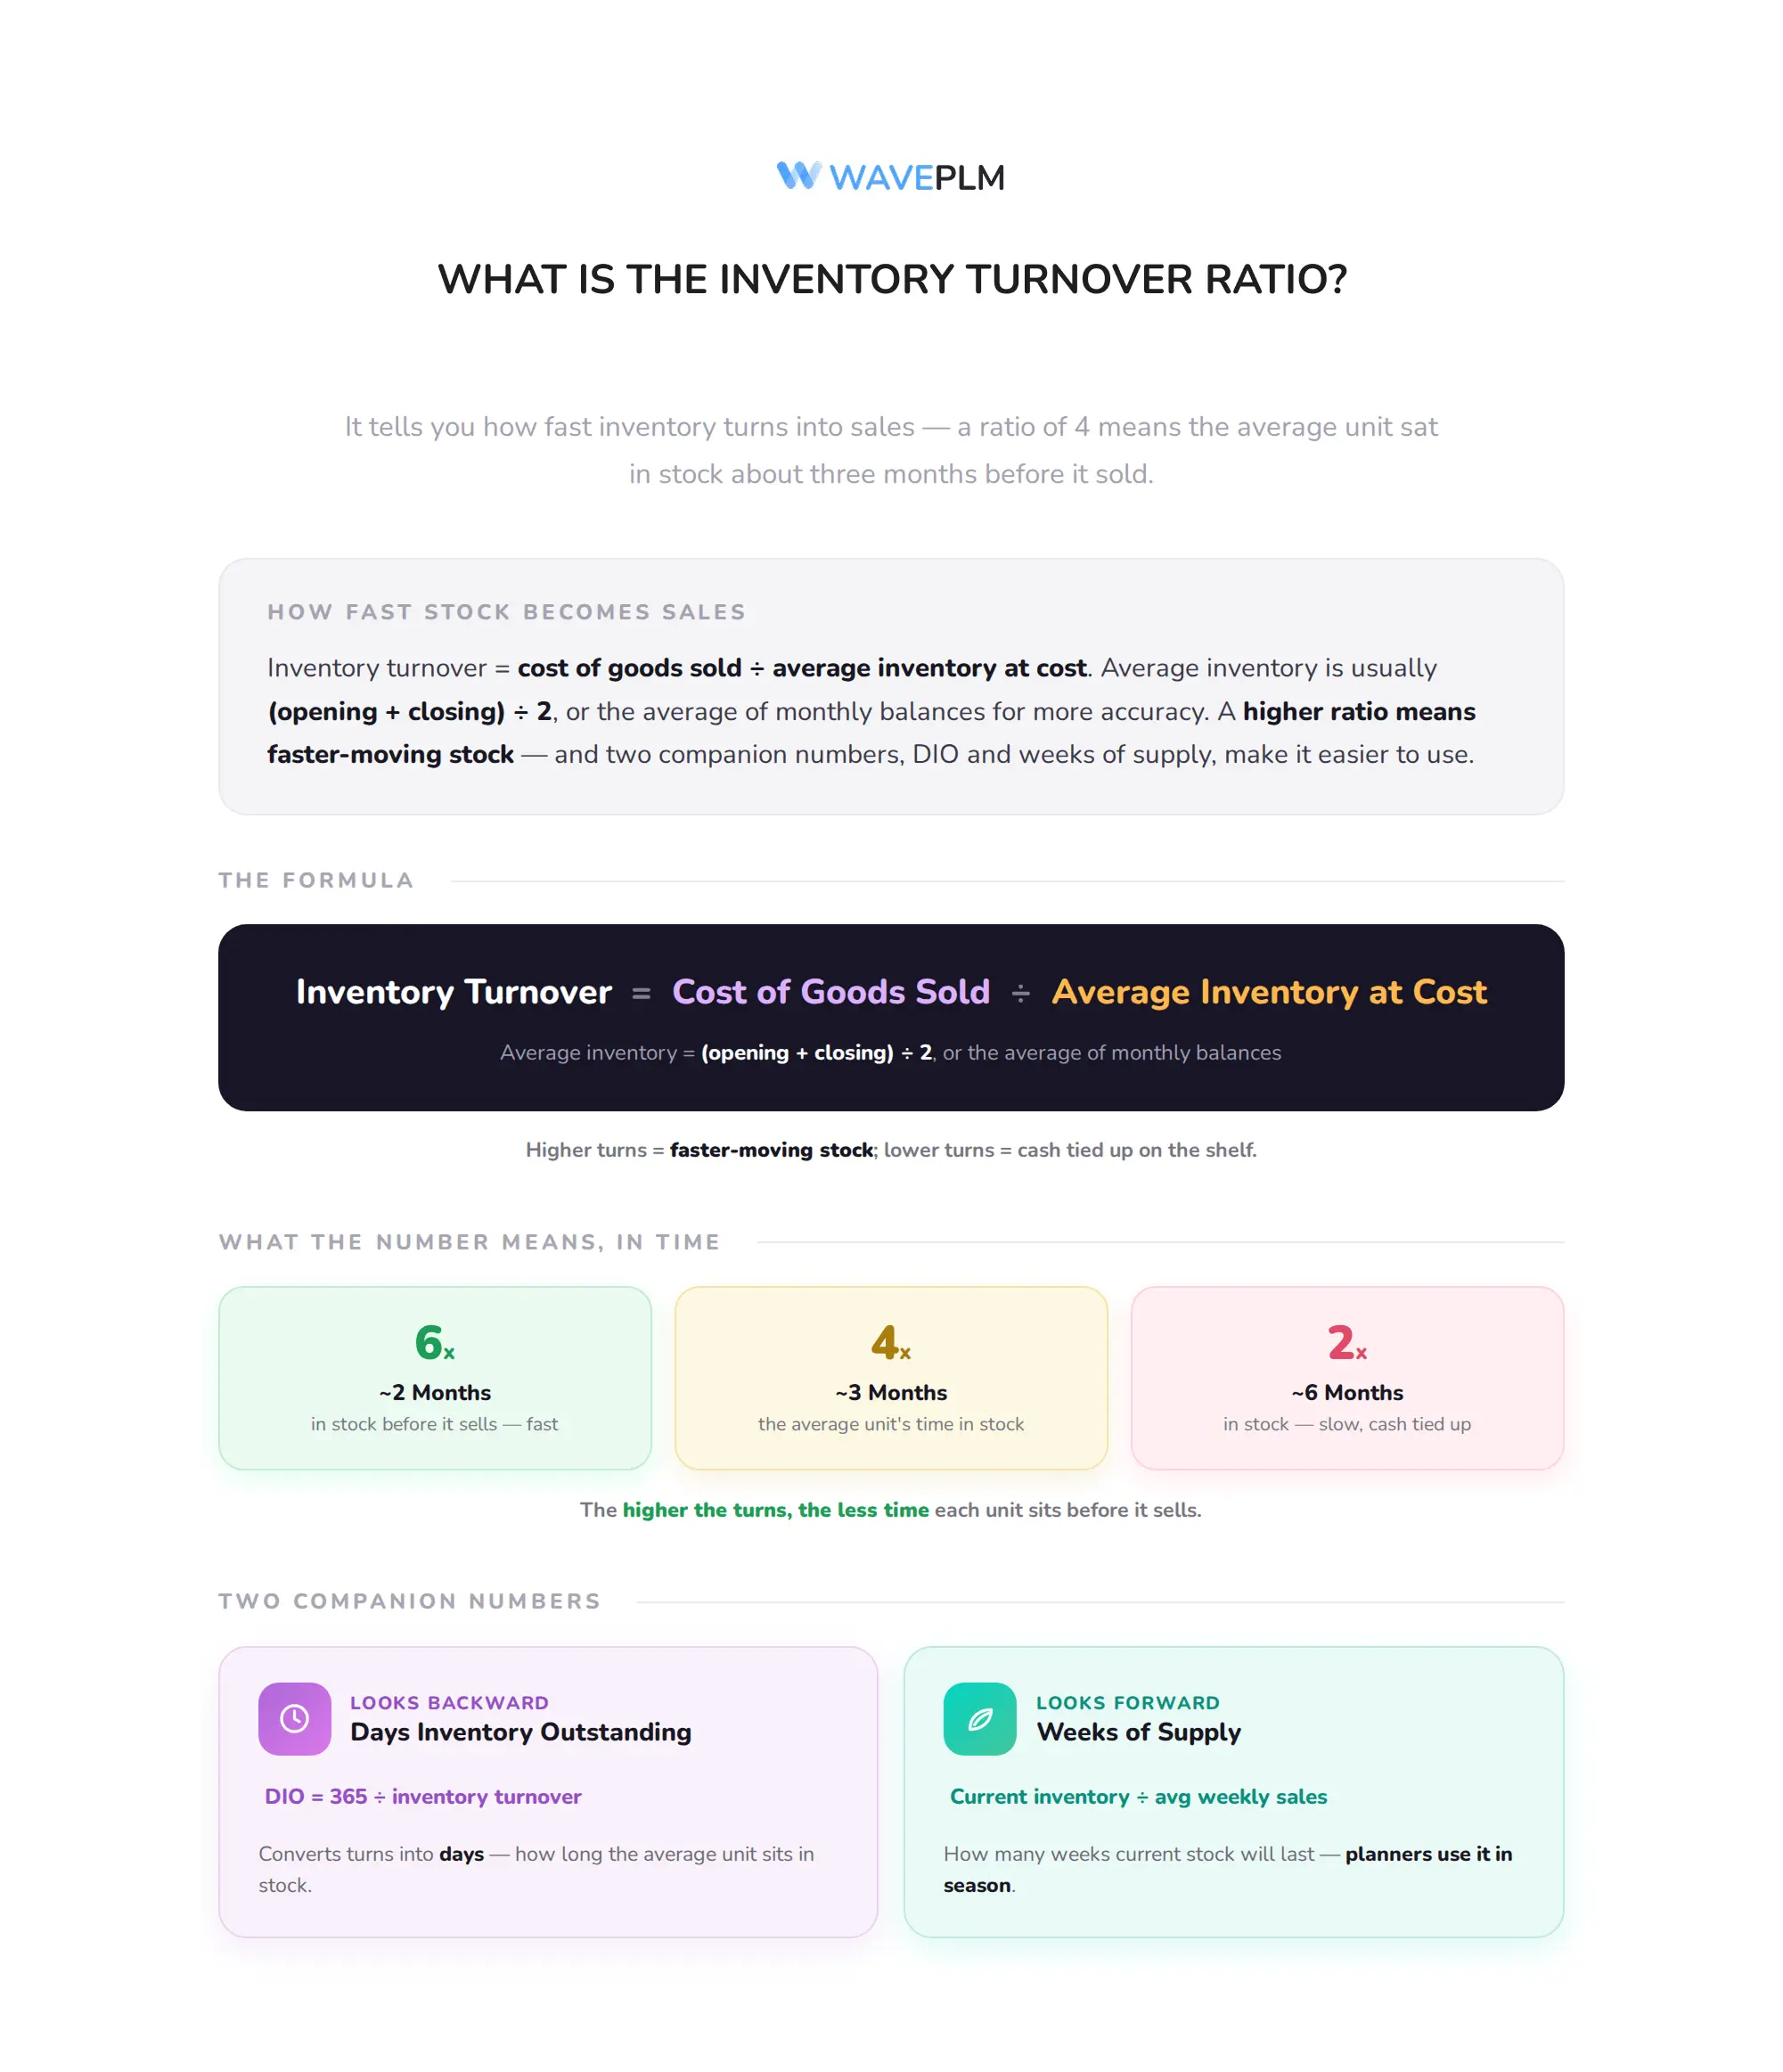
Here is a worked example for a small brand selling through its own site and a few wholesale accounts.
| Line | Value | How it is calculated |
|---|---|---|
| Cost of goods sold (year) | $2,400,000 | From the income statement, at landed cost |
| Opening inventory at cost | $700,000 | Balance sheet, start of year |
| Closing inventory at cost | $900,000 | Balance sheet, end of year |
| Average inventory | $800,000 | (700,000 + 900,000) ÷ 2 |
| Inventory turnover ratio | 3.0 | 2,400,000 ÷ 800,000 |
| Days inventory outstanding | 122 days | 365 ÷ 3.0 |
Note that both numbers must be at cost. Otherwise, dividing retail sales by inventory at cost inflates the ratio, because sales include your margin. Equally, use landed cost, not FOB, so duty and freight are counted on both sides. Our guide to landed cost for apparel imports shows what belongs in that number.
What Is a Good Inventory Turnover Ratio for Apparel?
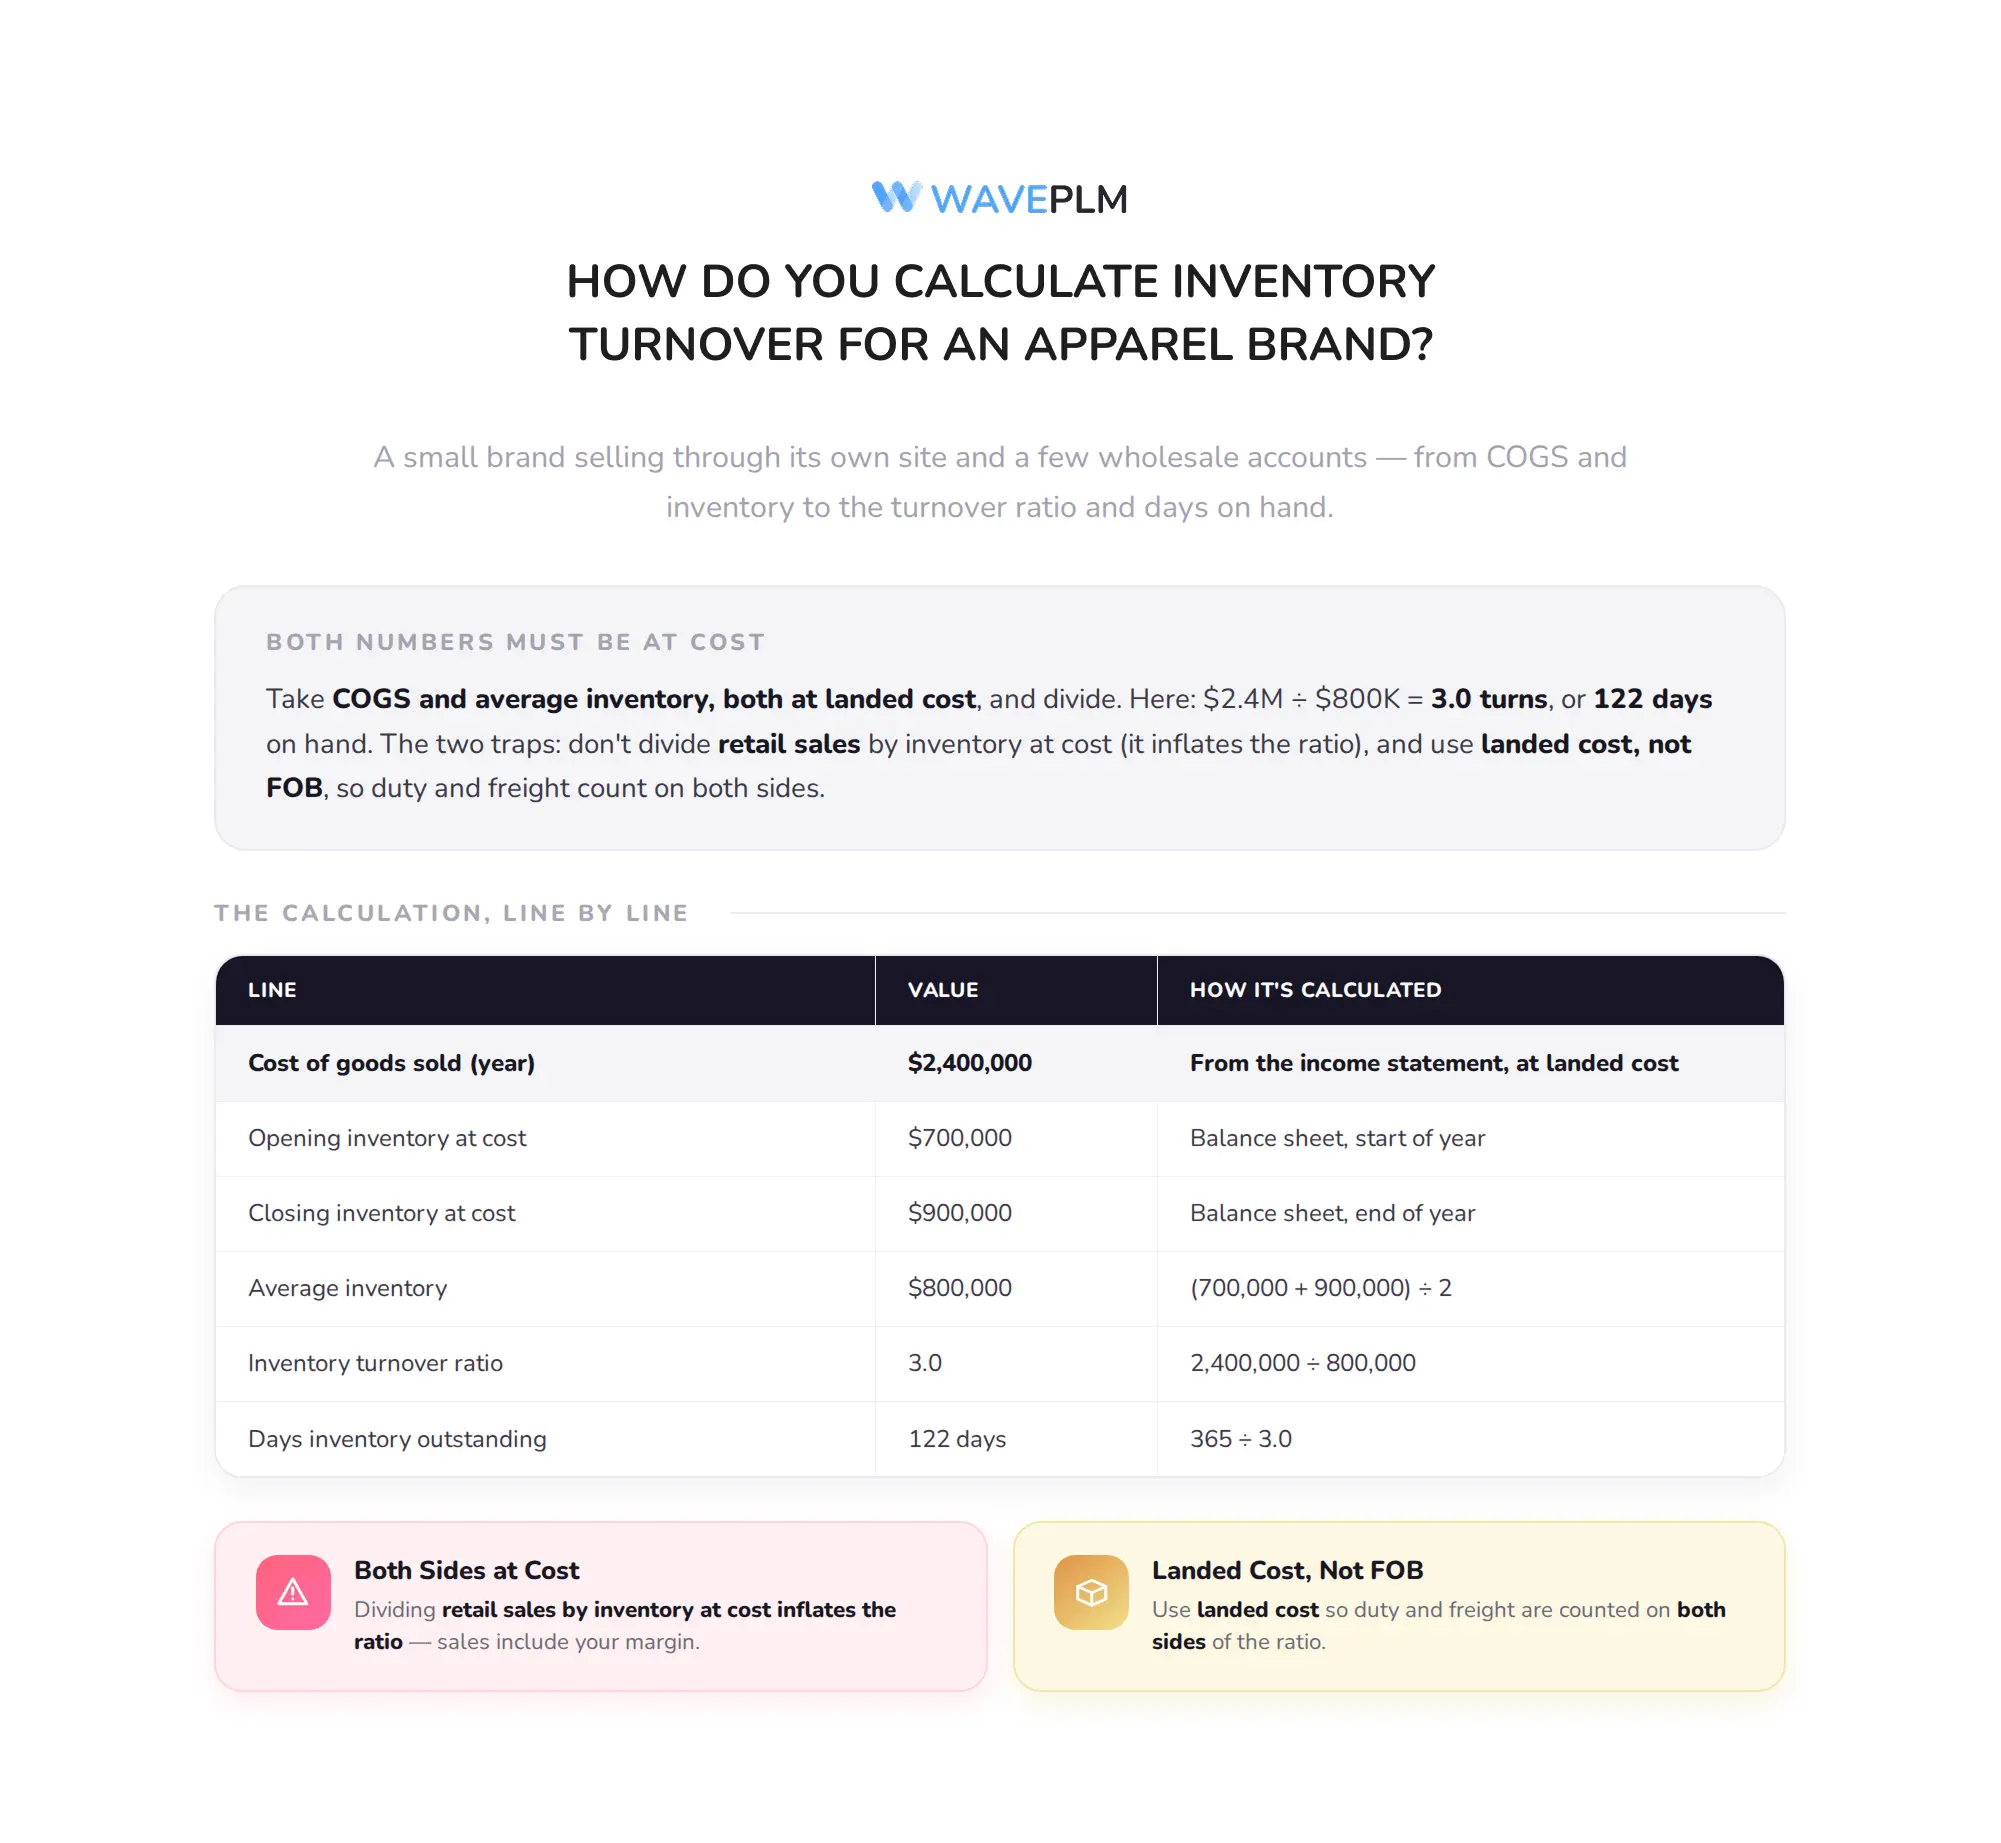
In fact, there is no single right number, because a basics brand and a seasonal fashion label run very different models. Still, two public data sets give a useful reference point.
Industry data: The US Census Bureau reported an inventory-to-sales ratio of 2.14 months for clothing and accessories stores in June 2026, down from 2.19 a year earlier. Meanwhile, Aswath Damodaran’s January 2026 industry data puts US public apparel companies at about 5.2 turns a year on a sales basis, or roughly 70 days of stock (both as summarised by Onramp Funds, September 2026).
Keep in mind that sales-basis figures run higher than the cost-basis inventory turnover ratio in this guide, because sales include margin. For a smaller brand reporting at cost, the ranges below are a more practical starting point. Notably, they are a Wave PLM summary of typical patterns, not a published standard.
| Business model | Typical turns at cost | Why |
|---|---|---|
| Core basics with replenishment (tees, underwear, socks) | 4–6 | Small reorders, steady demand, few seasonal drops |
| Seasonal fashion brand, two main collections | 2–4 | Stock arrives in large drops and sells over months |
| Premium or luxury with long full-price windows | 1.5–3 | Deep size runs, slow markdown policy |
| Fast-fashion style frequent drops | 6+ | Small buys, quick reorders, short product life |
Above all, compare against your own trend. After all, a brand that moves from 2.5 to 3.0 turns in a year has freed real cash, whatever the industry average says.
How Is Inventory Turnover Different From Sell-Through Rate?
The two metrics answer different questions, so apparel teams need both. Sell-through rate looks at one buy: what share of the units you received sold in a period. In contrast, the inventory turnover ratio looks at the whole business over a year, in money rather than units.
For example, a style can show 80% sell-through in eight weeks and still drag turns down if you over-bought ten other colourways that sat. Our guide to sell-through rate covers the unit-level view, including benchmarks by week.
What Is GMROI and Why Does It Matter?
Turns alone can mislead. Specifically, you can raise turns by discounting everything, but you will not make more money. That is why merchants pair the inventory turnover ratio with GMROI, the gross margin return on inventory investment.
Definition: GMROI = gross margin dollars ÷ average inventory at cost. It tells you how many dollars of gross margin each dollar of inventory earned in the period.
Using the same brand as above, suppose sales were $4,200,000 and cost of goods sold was $2,400,000. As a result, gross margin is $1,800,000, and GMROI is 1,800,000 ÷ 800,000 = 2.25. In other words, every dollar of stock earned $2.25 in gross margin over the year.
GMROI is especially useful for comparing categories. For instance, outerwear may turn slowly yet earn a strong GMROI because of its margin, while a promotional basic may turn fast with a weak GMROI. Similarly, pricing decisions, such as your keystone markup or wholesale price sheet, move GMROI directly.
Why Is Inventory Turnover Low in So Many Apparel Brands?
When turns are low, teams usually blame the forecast. Often, however, the stock problem was locked in months earlier, during range planning and sourcing. In particular, four causes come up again and again.
- Too many SKUs for the demand. Every extra colourway and size multiplies the units you must buy to cover the grid, even when the total demand does not grow.
- Factory and mill minimums. A 300-unit minimum per colour forces you to buy 1,800 units across six colours, even if the forecast is 1,000. Our guide to MOQ in apparel manufacturing explains how to negotiate them.
- Size curves that do not match sales. Buying the same curve every season leaves broken runs of extreme sizes that never sell at full price.
- Late deliveries. Stock that lands three weeks late has three fewer weeks to sell before the markdown window, so it sits longer.
Our finding: In the brands we work with, the fastest way to raise turns is rarely a better forecast. More often, it is cutting the colourways that never earned their minimum, which shrinks inventory without touching the best sellers.

How Can an Apparel Brand Improve Inventory Turnover?
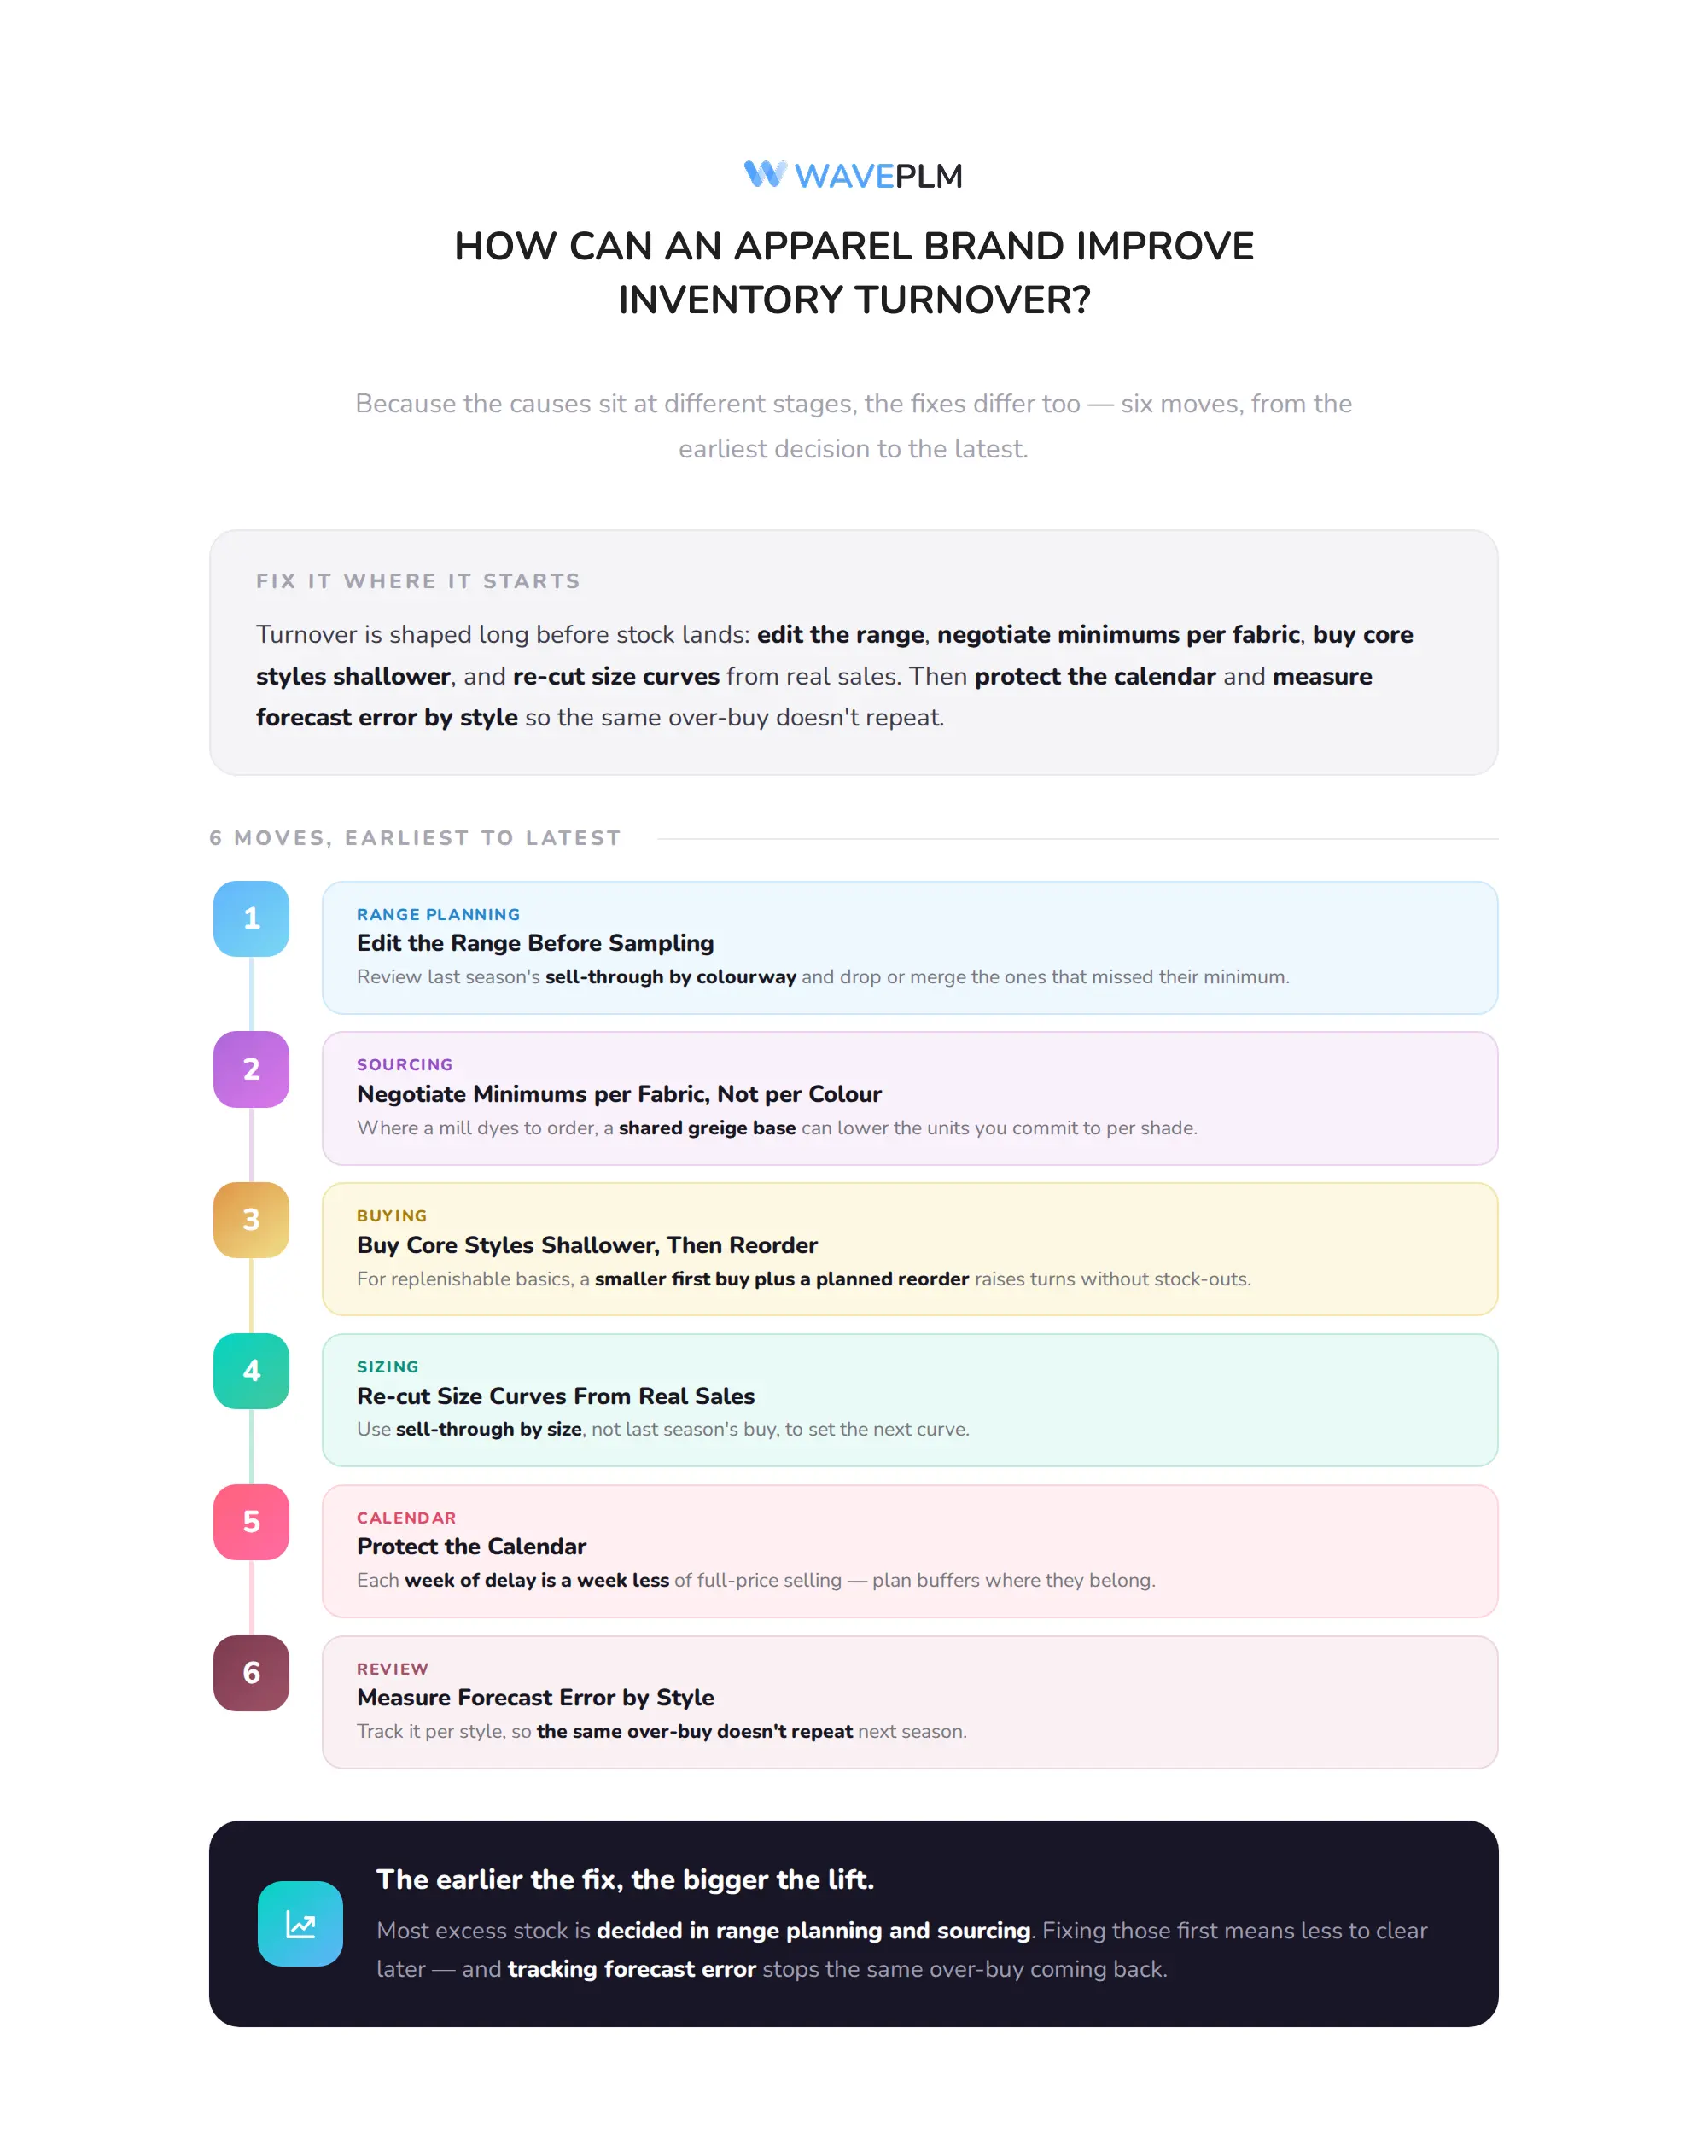
Because the causes sit at different stages, the fixes also differ. The list below runs from the earliest decision to the latest.
- Edit the range before sampling. Review last season’s sell-through by colourway, and drop or merge the ones that missed their minimum. Our assortment optimisation guide covers how to run that review.
- Negotiate minimums per fabric, not per colour. Where a mill dyes to order, a shared greige base can lower the units you commit to per shade.
- Buy core styles shallower, then reorder. For replenishable basics, a smaller first buy plus a planned reorder raises turns without risking stock-outs.
- Re-cut size curves from real sales. Use sell-through by size, not last season’s buy, to set the next curve.
- Protect the calendar. Each week of delay is a week less of full-price selling. Our seasonal planning calendar shows where buffers belong.
- Measure forecast error by style. Track it, so the same over-buy does not repeat. See our guide to demand forecast accuracy KPIs.
Where Should Each Style Sit Before the Next Buy?
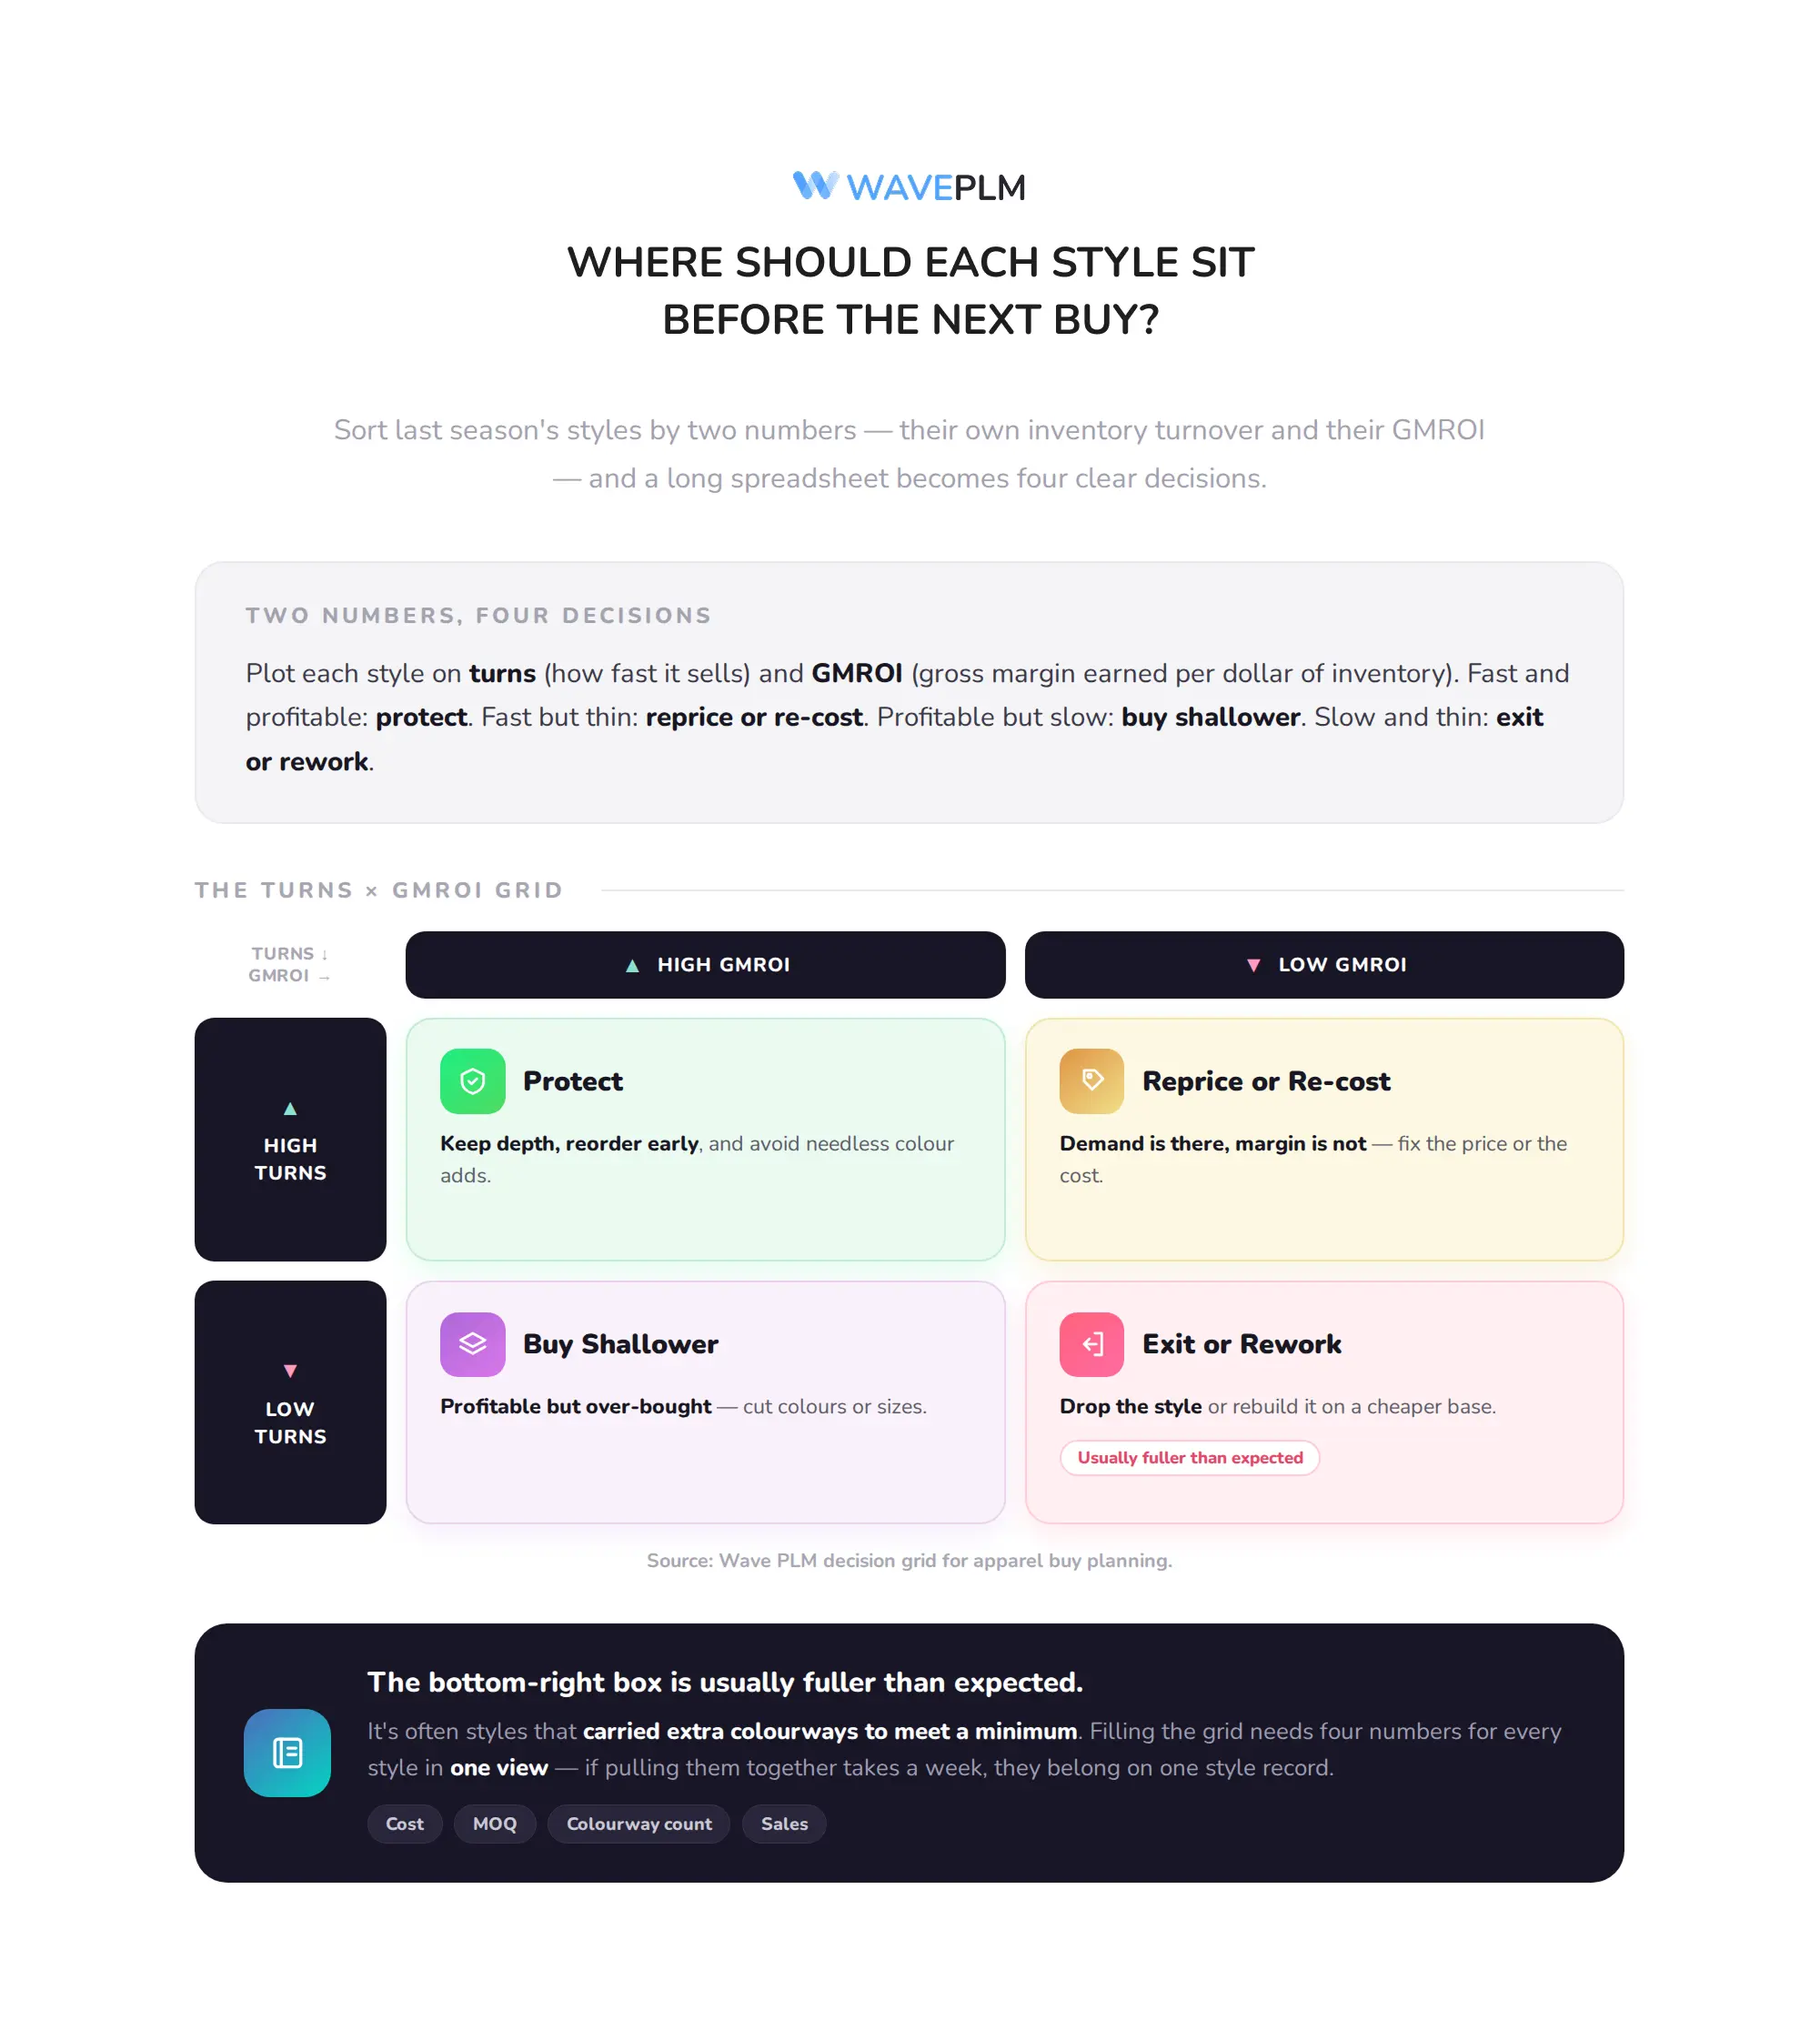
Before your next buy meeting, sort last season’s styles by two numbers: their own inventory turnover ratio and their GMROI. Then place each one on the grid below. As such, it turns a long spreadsheet into four clear decisions.
| High GMROI | Low GMROI | |
|---|---|---|
| High turns | Protect: keep depth, reorder early, avoid needless colour adds | Reprice or re-cost: demand is there, margin is not |
| Low turns | Buy shallower: profitable but over-bought; cut colours or sizes | Exit or rework: drop the style or rebuild it on a cheaper base |
Most brands find that the bottom-right box holds more styles than expected, usually ones that carried extra colourways to meet a minimum. To fill the grid you need cost, MOQ, colourway count, and sales for every style in one view. If pulling those together takes your team a week, ask us how Wave PLM brings them into one style record.
Frequently Asked Questions
What is the formula for the inventory turnover ratio?
The inventory turnover ratio equals cost of goods sold divided by average inventory at cost. Specifically, average inventory is usually the opening plus closing inventory, divided by two. For example, $2.4 million in cost of goods sold over $800,000 of average inventory gives a ratio of 3.
What inventory turnover ratio is good for clothing?
It depends on the model. US public apparel companies average about 5 turns a year on a sales basis, while many smaller brands run 2 to 4 turns at cost. In addition, basics with replenishment usually turn faster than seasonal fashion collections.
Is a higher inventory turnover always better?
Not always. Very high turns can signal stock-outs and lost sales, or heavy discounting that clears stock without profit. That is why apparel merchants pair inventory turnover with GMROI, which shows whether the stock is also earning margin.
What does an inventory turnover ratio of 1.5 mean?
A ratio of 1.5 means inventory sold and was replaced one and a half times in the year. In days, that is about 243 days, or roughly eight months of stock on hand. For most apparel brands, that suggests over-buying or a slow markdown policy.
How is GMROI calculated?
GMROI equals gross margin dollars divided by average inventory at cost. For example, $1.8 million of gross margin on $800,000 of average inventory gives a GMROI of 2.25. That means each dollar of inventory earned $2.25 of gross margin.
What is the difference between inventory turnover and sell-through?
Sell-through measures the share of units from one buy that sold in a period. In contrast, inventory turnover measures how often the whole inventory, in cost dollars, sold and was replaced over a year. Sell-through is a style-level, in-season metric, while turnover is a business-level one.
Conclusion
The inventory turnover ratio is a simple formula with a long chain of causes behind it. Therefore, calculate it at cost, compare it with your own trend before any benchmark, and read it next to GMROI so faster turns do not hide weaker margin. Then look upstream: range width, minimums, size curves, and delivery dates decide most of your turns before a single unit is sold.








Leave a Reply